


Whatever industry you're in, you're going to need to buy supplies. If you're a printer, you'll need to purchase inks, various types of printing equipment, and paper. If you're in manufacturing, you'll need to obtain parts that you don't make yourself.
But how do you know you're making the right choice when you have multiple suppliers vying to fulfill your orders? How can you be sure you're selecting the vendor with the highest quality, or eliminating the supplier whose products aren't meeting your expectations?
Let's take a look at an example from automotive manufacturing to see how we can use data to make an informed decision about the options.
Camshaft Problems
Thanks to camshafts that don’t meet specifications, too many of your car company's engines are failing. That’s harming your reputation and revenues. Your company has two different camshaft suppliers, and it's up to you to figure out if camshafts from one or both of them are failing to meet standards.
The camshafts in your engines must be 600 mm long, plus or minus 2 mm. To acquire a basic understanding of how your suppliers are doing, you measure 100 camshafts from each supplier, sampling 5 shafts each from 20 different batches and record the data in a Minitab worksheet.
Once you have your data in hand, the Assistant in Minitab Statistical Software can tell you what the data say. If you're not already using our software and you want to play along, you can get a free 30-day trial version.
Step 1: Graph the Data
Seeing your data in graphical form is always a good place to start your analysis. So in Minitab, select Assistant > Graphical Analysis.
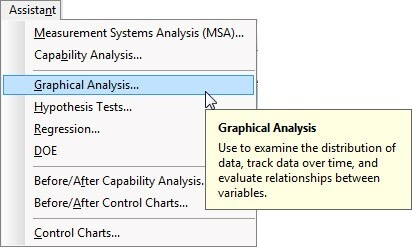
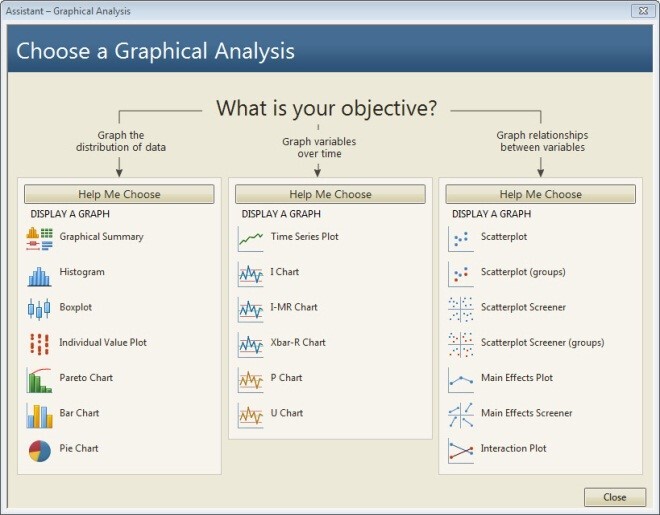
The Assistant offers you a choice of several different graph options for each of three possible objectives. Since we're not graphing variables over time, nor looking for relationships between variables, let's consider the options available under "Graph the distribution of data," which include histograms, boxplots, and Pareto charts among others.
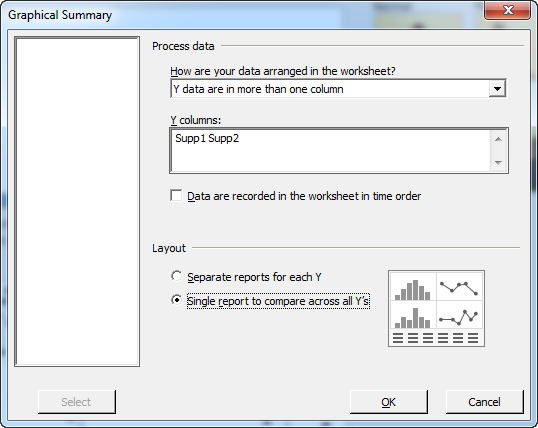
A basic summary of the data is a good place to start. Click the Graphical Summary button and complete the dialog box as shown.
The Assistant outputs a Diagnostic Report, a Report Card, and the Summary Report shown below.
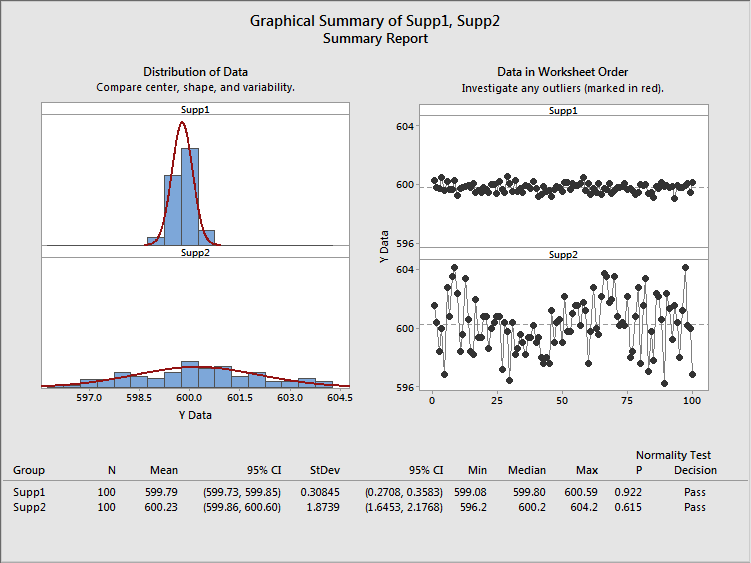
The data table in this summary report reveals that the means of the camshafts sampled from supplier 2 and supplier 1 are both very close to the target of 600 mm.
But the report also reveals a critical difference between the suppliers: while neither data set contains any outliers, there is clearly more variation in the lengths of camshafts from supplier 2.
The supplier 1 distribution graph on the left is clustered tightly around the mean, while the one for supplier 2 reflects a wider range of values. The graph of the data in worksheet order shows that supplier 1’s values hew tightly to the center line, compared to supplier 2’s more extreme up-and-down pattern of variation.
Returning to the table of summary statistics at the bottom of the output, a check of the basic statistics quantifies the difference in variation between the samples: the standard deviation of supplier 1's samples is 0.31, compared to 1.87 for supplier 2.
We already have solid evidence to support choosing supplier 1 over supplier 2, but the Assistant in Minitab makes it very easy to get even more insight about the performance of each supplier so you can make the most informed decision.
Step 2. Perform a Capability Analysis
You want to assess the ability of each supplier to deliver camshafts relative to your specifications, so you select the Capability Analysis option in the Assistant menu.
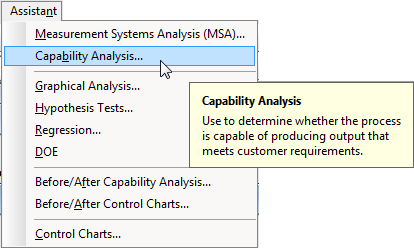
The analysis you need depends on what type of data you have. The measurements you’ve collected are continuous. The Assistant directs you to the appropriate analysis.
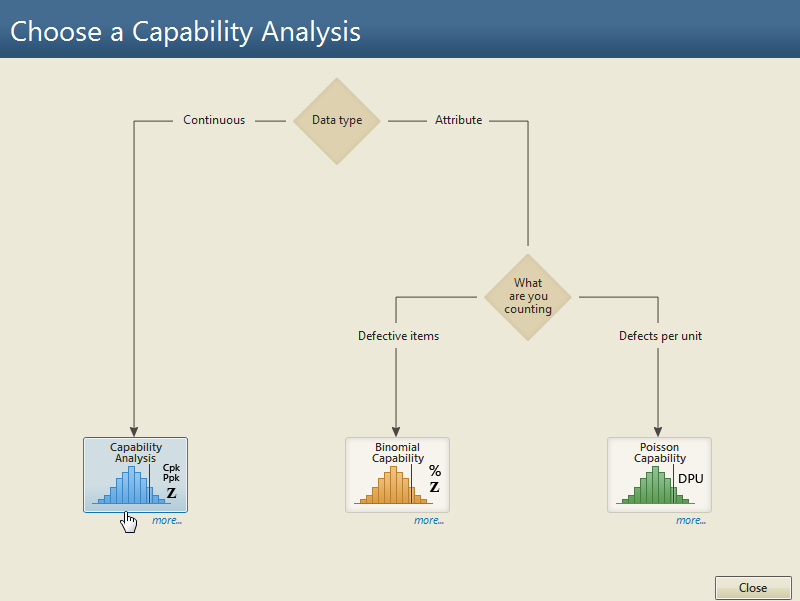
Clicking the more… button displays the requirements and assumptions that need to be satisfied for the analysis to be valid.
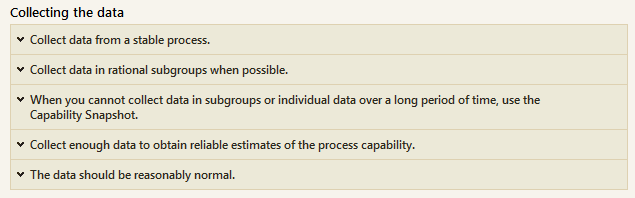
You already know your data are reasonably normal, that it’s been collected in rational subgroups, and that you have enough data for reliable estimates—we saw this in the initial Graphical Analysis.
However, the Assistant also notes that you should collect data from a process that is stable. You haven’t evaluated that yet…but fortunately, the Assistant automatically assesses process stability as part of its capability analysis.
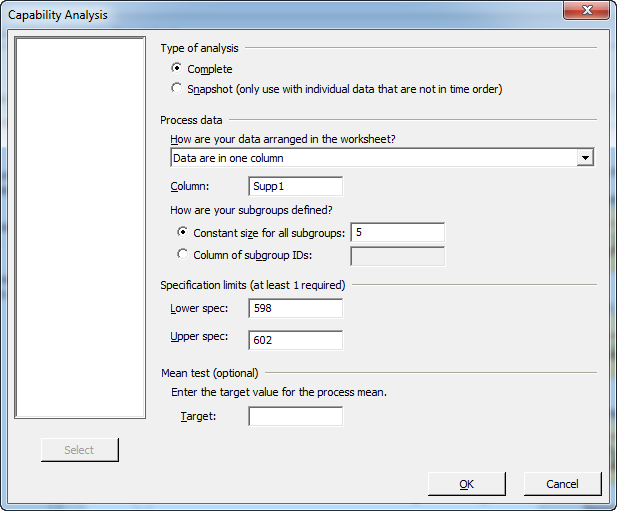
Confident that your data were collected appropriately, you click the Capability Analysis button and complete the dialog box as shown to analyze Supplier 1:
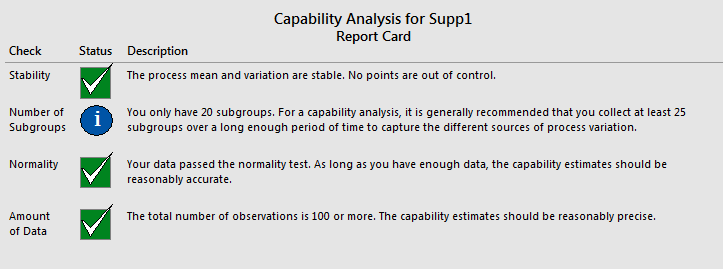
The Assistant produces all the output you need in a clear, easy-to-follow format. The Diagnostic Report offers detailed information about the analysis, while the Report Card flags potential problems. In this case, the Report Card verified that the data were from a stable process and that the analysis should be reasonably precise and accurate.
The Summary Report gives you the bottom-line results of the analysis.
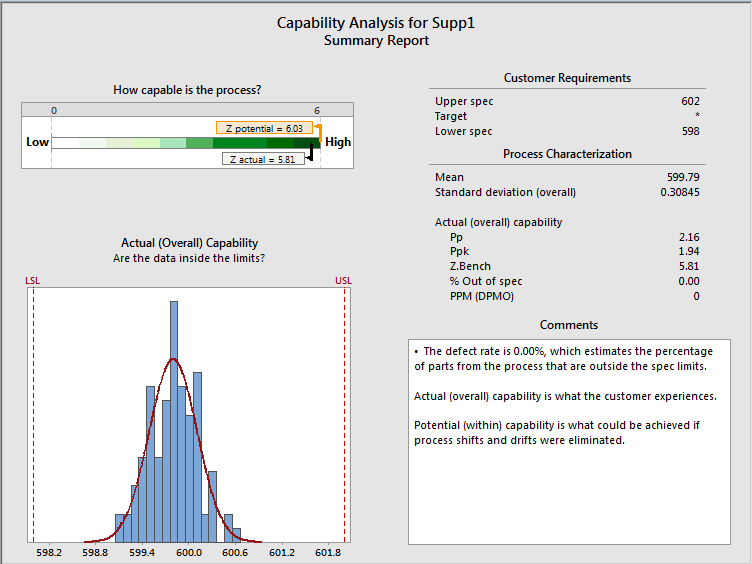
As shown in the scale at the top left of the report, Supplier 1’s process is very capable of delivering camshafts that meet your requirements. The histogram shows that all of the data fall within specifications, while the Ppk measurement of overall capability is 1.94, exceeding the typical industry benchmark of 1.33.
Now you perform the analysis for Supplier 2. Once again, the Report Card verifies the stability of the process and confirms that the capability analysis should be reasonably accurate and precise. However, the Assistant’s Summary Report for Supplier 2 reveals a very different situation in most other respects:
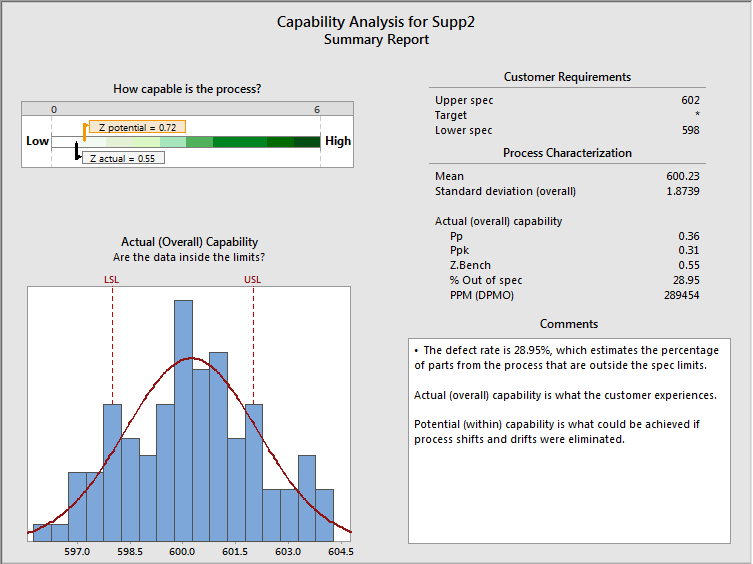
The scale at the top left of the report shows that Supplier 2’s ability to provide parts that meet your specifications is quite low, while the histogram shows that an alarming number of the camshafts in your sample fall outside your spec limits. Supplier 2’s Ppk is 0.31, far below the 1.33 industry benchmark. And with a defect rate of 28.95%, you can expect more than a quarter of the motors you assemble using Supplier 2’s camshafts to require rework!
You can use the Assistant output you created to explain exactly why you should continue to acquire camshafts from Supplier 1. In addition, even though you’ll discontinue using Supplier 2 for now, you can give this supplier important information to help them improve their processes for the future.
A Clear Answer
Whatever your business, you count on your suppliers to provide deliverables that meet your requirements. You have seen how the Assistant can help you visualize the quality of the goods you receive, and perform a detailed analysis of your suppliers’ capability to deliver quality products.