


Confidence intervals show the range of values we can be fairly, well, confident, that our true value lies in, and they are very important to any quality practitioner. I could be 95% confident the volume of a can of soup will be 390-410 ml. I could be 99% confident under 2% of the products in my batch are defective.
Demonstrating an improvement to the process often involves proving a significant improvement in the mean, so that’s what we tend to focus on – the center of a distribution.
Defects don’t fall in the center, though. They fall in the tails. You can find more beneficial insights in many situations through examining the tails of the distribution rather than just focusing on the mean.
Let’s take a look at some non-traditional confidence intervals that are particularly useful in estimating the percent that fall inside or outside the specification limits.
Estimating the 99th Percentile on Time to Complete Hospital Lab Work
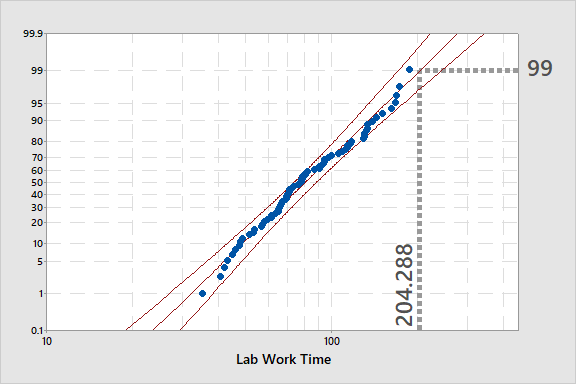
A probability plot is most often used to help you determine whether your data follows a normal distribution (based on how linear the points appear to be). It provides a good starting point for understanding percentiles. A percentile is the value at which a given percentage of the population is estimated to fall below.
But did you know probability plots also provide estimates of the percentiles of the distribution? You can choose any percentile you want on the Y axis and find the corresponding data value on the X axis. The corresponding confidence intervals on the probability plot are confidence intervals for the specific percentile.
I was recently working on a project with a hospital that needed to estimate within how many minutes 99% of their pre-surgery lab work falls.
The X value corresponding to Y = 99 on the probability plot was 204 minutes. In other words, 99% of all pre-lab work should be complete by 204 minutes.
The confidence interval around the estimate indicated that we could be 95% confident that 99% of the lab work would be complete by 171-244 minutes. This explained why the surgeries were often falling behind schedule.
Demonstrating Reliability of Medical Tubing Using Tolerance Intervals
While percentiles estimate the percent of observations that fall below a certain value, tolerance intervals provide a range that you can be confident a certain percentage will fall between.
They are very useful for determining where a certain percentage of the population will fall relative to your specification limits.
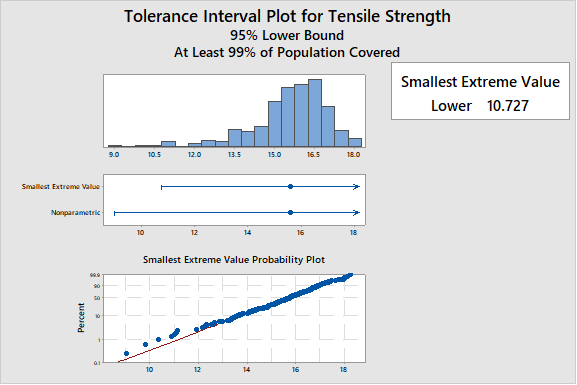
For example, a medical device company I was working with needed to show 95/99 reliability on the tensile strength of plastic tubing. The specific requirement was that they needed to be 95% confident that the tubing would withstand 3 pounds of force for 99% of product.
Like the hospital data, these data were non-normal. Because a tolerance interval estimates what is going on in the tails of the distribution – not the mean – the distribution assumption is important. Here, an extreme value distribution provided a good distribution fit. Because the tubing could not be too strong, a one-sided tolerance limit, a lower bound, was appropriate. The value of the 99% lower tolerance bound with 95% confidence was 10.7 pounds. In other words, we could be 95% confident that 99% of the tubing population has a tensile strength of at least 10.7 pounds – well above the specification limit of 3 pounds.
Percentiles vs Tolerance
Consider using confidence intervals on percentiles or tolerance intervals the next time you are interested in interval estimation involving the tails of a distribution:
- Percentiles estimate the value that a given percentage of the population falls below.
- Tolerance intervals estimate the range of measurements a given percentage of the population will falls within.