


Previously, I’ve written about when to choose nonlinear regression and how to model curvature with both linear and nonlinear regression. Since then, I’ve received several comments expressing confusion about what differentiates nonlinear equations from linear equations. This confusion is understandable because both types can model curves.
So, if it’s not the ability to model a curve, what is the difference between a linear and nonlinear regression equation?
Linear Regression Equations
Linear regression requires a linear model. No surprise, right? But what does that really mean?
A model is linear when each term is either a constant or the product of a parameter and a predictor variable. A linear equation is constructed by adding the results for each term. This constrains the equation to just one basic form:
Response = constant + parameter * predictor + ... + parameter * predictor
Y = b o + b1X1 + b2X2 + ... + bkXk
In statistics, a regression equation (or function) is linear when it is linear in the parameters. While the equation must be linear in the parameters, you can transform the predictor variables in ways that produce curvature. For instance, you can include a squared variable to produce a U-shaped curve.
Y = b o + b1X1 + b2X12
This model is still linear in the parameters even though the predictor variable is squared. You can also use log and inverse functional forms that are linear in the parameters to produce different types of curves.
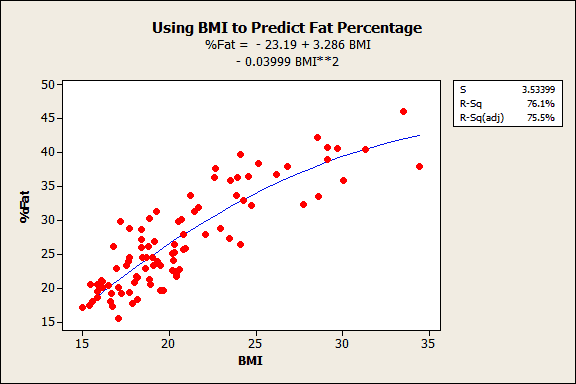
Here is an example of a linear regression model that uses a squared term to fit the curved relationship between BMI and body fat percentage.
Nonlinear Regression Equations
While a linear equation has one basic form, nonlinear equations can take many different forms. The easiest way to determine whether an equation is nonlinear is to focus on the term “nonlinear” itself. Literally, it’s not linear. If the equation doesn’t meet the criteria above for a linear equation, it’s nonlinear.
That covers many different forms, which is why nonlinear regression provides the most flexible curve-fitting functionality. Here are several examples from Minitab’s nonlinear function catalog. Thetas represent the parameters and X represents the predictor in the nonlinear functions. Unlike linear regression, these functions can have more than one parameter per predictor variable.
| Nonlinear function | One possible shape |
|---|---|
| Power (convex): Theta1 * X^Theta2 | 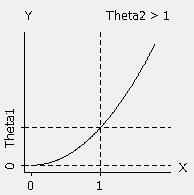 |
| Weibull growth: Theta1 + (Theta2 - Theta1) * exp(-Theta3 * X^Theta4) | 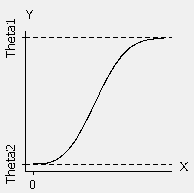 |
| Fourier: Theta1 * cos(X + Theta4) + (Theta2 * cos(2*X + Theta4) + Theta3 | 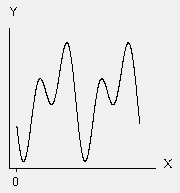 |
Here is an example of a nonlinear regression model of the relationship between density and electron mobility.
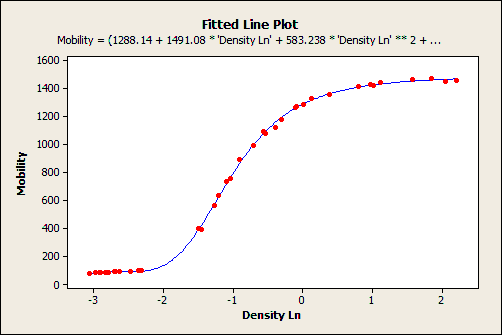
The nonlinear equation is so long it that it doesn't fit on the graph:
Mobility = (1288.14 + 1491.08 * Density Ln + 583.238 * Density Ln^2 + 75.4167 * Density Ln^3) / (1 + 0.966295 * Density Ln + 0.397973 * Density Ln^2 + 0.0497273 * Density Ln^3)
Linear and nonlinear regression are actually named after the functional form of the models that each analysis accepts. I hope the distinction between linear and nonlinear equations is clearer and that you understand how it’s possible for linear regression to model curves! It also explains why you’ll see R-squared displayed for some curvilinear models even though it’s impossible to calculate R-squared for nonlinear regression.
If you're learning about regression, read my regression tutorial!