Analysis of variance (ANOVA) can determine whether the means of three or more groups are different. ANOVA uses F-tests to statistically test the equality of means. In this post, I’ll show you how ANOVA and F-tests work using a one-way ANOVA example.
But wait a minute...have you ever stopped to wonder why you’d use an analysis of variance to determine whether means are different? I'll also show how variances provide information about means.
As in my posts about understanding t-tests, I’ll focus on concepts and graphs rather than equations to explain ANOVA F-tests.
What are F-statistics and the F-test?
F-tests are named after its test statistic, F, which was named in honor of Sir Ronald Fisher. The F-statistic is simply a ratio of two variances. Variances are a measure of dispersion, or how far the data are scattered from the mean. Larger values represent greater dispersion.
Variance is the square of the standard deviation. For us humans, standard deviations are easier to understand than variances because they’re in the same units as the data rather than squared units. However, many analyses actually use variances in the calculations.
F-statistics are based on the ratio of mean squares. The term “mean squares” may sound confusing but it is simply an estimate of population variance that accounts for the degrees of freedom (DF) used to calculate that estimate.
Despite being a ratio of variances, you can use F-tests in a wide variety of situations. Unsurprisingly, the F-test can assess the equality of variances. However, by changing the variances that are included in the ratio, the F-test becomes a very flexible test. For example, you can use F-statistics and F-tests to test the overall significance for a regression model, to compare the fits of different models, to test specific regression terms, and to test the equality of means.
Using the F-test in One-Way ANOVA
To use the F-test to determine whether group means are equal, it’s just a matter of including the correct variances in the ratio. In one-way ANOVA, the F-statistic is this ratio:
F = variation between sample means / variation within the samples
The best way to understand this ratio is to walk through a one-way ANOVA example.
We’ll analyze four samples of plastic to determine whether they have different mean strengths. (If you don't have Minitab, you can download a free 30-day trial.) I'll refer back to the one-way ANOVA output as I explain the concepts.
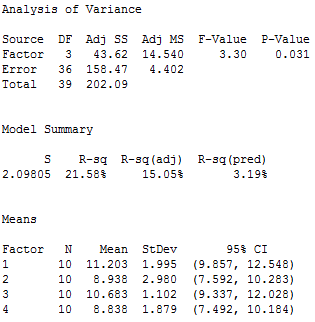
In Minitab, choose Stat > ANOVA > One-Way ANOVA... In the dialog box, choose "Strength" as the response, and "Sample" as the factor. Press OK, and Minitab's Session Window displays the following output:
Numerator: Variation Between Sample Means
One-way ANOVA has calculated a mean for each of the four samples of plastic. The group means are: 11.203, 8.938, 10.683, and 8.838. These group means are distributed around the overall mean for all 40 observations, which is 9.915. If the group means are clustered close to the overall mean, their variance is low. However, if the group means are spread out further from the overall mean, their variance is higher.
Clearly, if we want to show that the group means are different, it helps if the means are further apart from each other. In other words, we want higher variability among the means.
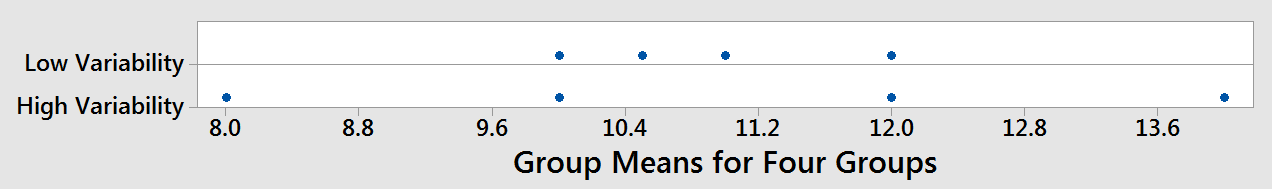
Imagine that we perform two different one-way ANOVAs where each analysis has four groups. The graph below shows the spread of the means. Each dot represents the mean of an entire group. The further the dots are spread out, the higher the value of the variability in the numerator of the F-statistic.
What value do we use to measure the variance between sample means for the plastic strength example? In the one-way ANOVA output, we’ll use the adjusted mean square (Adj MS) for Factor, which is 14.540. Don’t try to interpret this number because it won’t make sense. It’s the sum of the squared deviations divided by the factor DF. Just keep in mind that the further apart the group means are, the larger this number becomes.
Denominator: Variation Within the Samples
We also need an estimate of the variability within each sample. To calculate this variance, we need to calculate how far each observation is from its group mean for all 40 observations. Technically, it is the sum of the squared deviations of each observation from its group mean divided by the error DF.
If the observations for each group are close to the group mean, the variance within the samples is low. However, if the observations for each group are further from the group mean, the variance within the samples is higher.
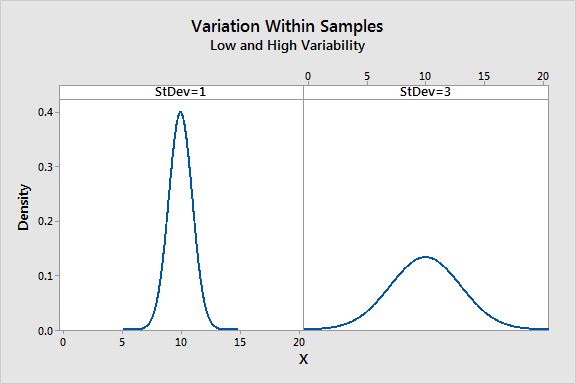
In the graph, the panel on the left shows low variation in the samples while the panel on the right shows high variation. The more spread out the observations are from their group mean, the higher the value in the denominator of the F-statistic.
If we’re hoping to show that the means are different, it's good when the within-group variance is low. You can think of the within-group variance as the background noise that can obscure a difference between means.
For this one-way ANOVA example, the value that we’ll use for the variance within samples is the Adj MS for Error, which is 4.402. It is considered “error” because it is the variability that is not explained by the factor.
Ready for a demo of Minitab Statistical Software? Just ask!

The F-Statistic: Variation Between Sample Means / Variation Within the Samples
The F-statistic is the test statistic for F-tests. In general, an F-statistic is a ratio of two quantities that are expected to be roughly equal under the null hypothesis, which produces an F-statistic of approximately 1.
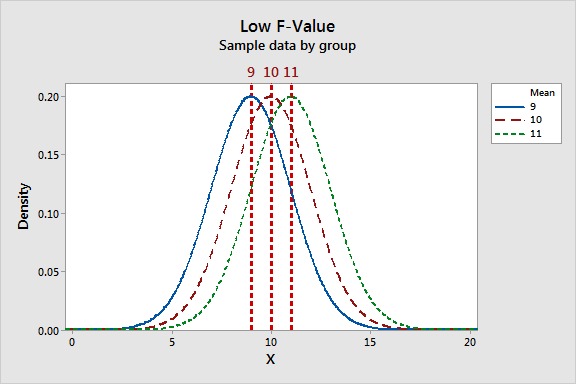
The F-statistic incorporates both measures of variability discussed above. Let's take a look at how these measures can work together to produce low and high F-values. Look at the graphs below and compare the width of the spread of the group means to the width of the spread within each group.
 |
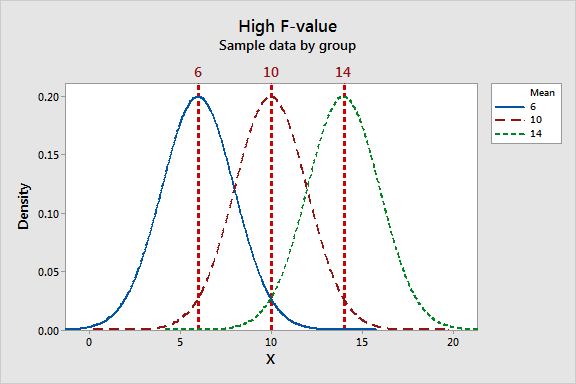 |
The low F-value graph shows a case where the group means are close together (low variability) relative to the variability within each group. The high F-value graph shows a case where the variability of group means is large relative to the within group variability. In order to reject the null hypothesis that the group means are equal, we need a high F-value.
For our plastic strength example, we'll use the Factor Adj MS for the numerator (14.540) and the Error Adj MS for the denominator (4.402), which gives us an F-value of 3.30.
Is our F-value high enough? A single F-value is hard to interpret on its own. We need to place our F-value into a larger context before we can interpret it. To do that, we’ll use the F-distribution to calculate probabilities.
F-distributions and Hypothesis Testing
For one-way ANOVA, the ratio of the between-group variability to the within-group variability follows an F-distribution when the null hypothesis is true.
When you perform a one-way ANOVA for a single study, you obtain a single F-value. However, if we drew multiple random samples of the same size from the same population and performed the same one-way ANOVA, we would obtain many F-values and we could plot a distribution of all of them. This type of distribution is known as a sampling distribution.
Because the F-distribution assumes that the null hypothesis is true, we can place the F-value from our study in the F-distribution to determine how consistent our results are with the null hypothesis and to calculate probabilities.
The probability that we want to calculate is the probability of observing an F-statistic that is at least as high as the value that our study obtained. That probability allows us to determine how common or rare our F-value is under the assumption that the null hypothesis is true. If the probability is low enough, we can conclude that our data is inconsistent with the null hypothesis. The evidence in the sample data is strong enough to reject the null hypothesis for the entire population.
This probability that we’re calculating is also known as the p-value!
To plot the F-distribution for our plastic strength example, I’ll use Minitab’s probability distribution plots. In order to graph the F-distribution that is appropriate for our specific design and sample size, we'll need to specify the correct number of DF. Looking at our one-way ANOVA output, we can see that we have 3 DF for the numerator and 36 DF for the denominator.
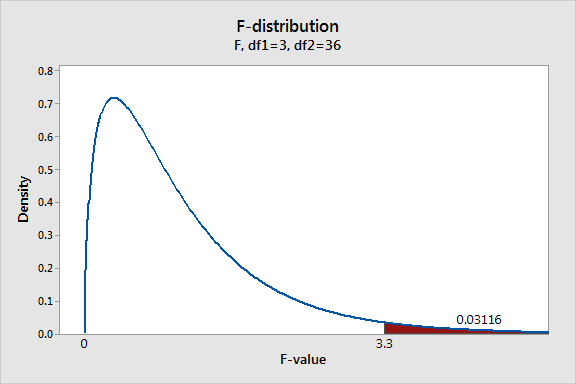
The graph displays the distribution of F-values that we'd obtain if the null hypothesis is true and we repeat our study many times. The shaded area represents the probability of observing an F-value that is at least as large as the F-value our study obtained. F-values fall within this shaded region about 3.1% of the time when the null hypothesis is true. This probability is low enough to reject the null hypothesis using the common significance level of 0.05. We can conclude that not all the group means are equal.
Learn how to correctly interpret the p-value.
Assessing Means by Analyzing Variation
ANOVA uses the F-test to determine whether the variability between group means is larger than the variability of the observations within the groups. If that ratio is sufficiently large, you can conclude that not all the means are equal.
This brings us back to why we analyze variation to make judgments about means. Think about the question: "Are the group means different?" You are implicitly asking about the variability of the means. After all, if the group means don't vary, or don't vary by more than random chance allows, then you can't say the means are different. And that's why you use analysis of variance to test the means.