


In my recent meetings with people from various companies in the service industries, I realized that one of the problems they face is that they were collecting large amounts of "qualitative" data: types of product, customer profiles, different subsidiaries, several customer requirements, etc.
As I discussed in my previous post, one way to look at qualitative data is to use different types of charts, including pie charts, stacked bar charts, and Pareto charts. In this post, we'll cover how to dig deeper into qualitative data with Chi-square analysis and multivariate analysis.
A Chi-Square Test with Qualitative Data
The table below shows which statistical methods can be used to analyze data according to the nature of such data (qualitative or numeric/quantitative). Even when the output (Y) is qualitative and the input (predictor : X) is also qualitative, at least one statistical method is relevant and can be used : the Chi-Square test.
| X \ Y |
Numeric/quantitative Output |
Qualitative Output |
| Numeric/quantitative Input |
Regression |
Logistic Regression |
| Qualitative Input |
ANOVA T tests |
Chi-Square Proportion tests |
Let's perform the Chi-square test of statistical significance on the same qualitative mistakes data I used in my previous post:
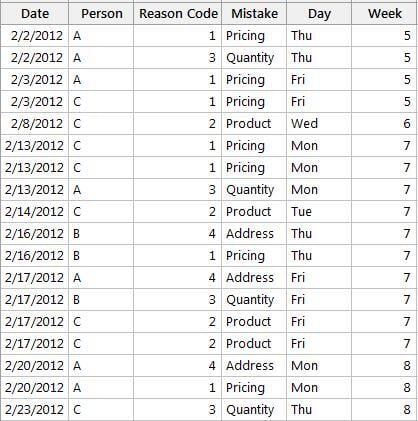
In Minitab Statistical Software, go to Stat > Tables > Cross Tabulation and Chi-square... In the output below, you can see that for each Employee / Error type combination, observed counts are obtained. Below that, expected counts (based on the assumption that the distribution of types of errors is strictly identical for each employee) are displayed. And below the expected count is displayed that combination's contribution to the overall Chi-Square.
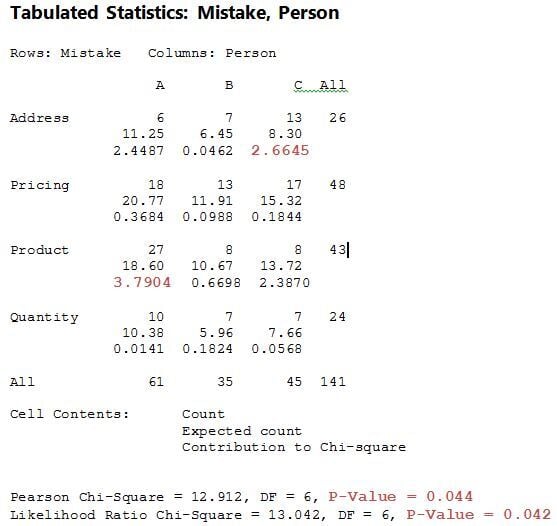
A low p-value (p = 0.042 <0.05), shown below the table, indicates a significant difference in the distribution of error types according to the three employees.
We then need to consider the major contributions to the overall chi-square:
Largest contribution: 3.79 for the Mistake type: “Product” & Employee: A combination. Note that in this case, for that particular cell, the number of observed errors for “product” (third row) and employee A (first column of the table) is much larger than the number of expected errors. Due to that difference the contribution for that particular combination is large : 3.79.
Second largest contribution: 2.66 for the Error type: “Address” & employee: C combination. Note that for this particular combination (i.e., this particular cell in the table) the observed number of address errors is much larger than the number of expected errors for Employee C (and therefore the contribution 2.66 is quite large).
Simple Correspondence (Multivariate) Analysis for Qualitative Data
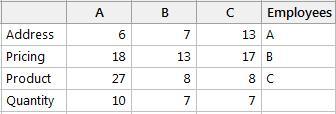
This third approach to analyzing qualitative data is more complex and computationally intensive but this is also a very effective and explicit statistical tool from a graphical point of view. In Minitab, go to Stat > Multivariate > Simple Correspondence Analysis...
To do this analysis, I rearranged the data in a two way contingency table, with the addition of a column for the employee names :
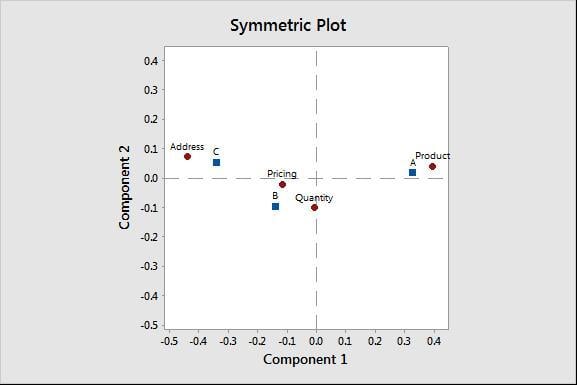
The simple correspondence symmetric plot below indicates that “Product” type errors are more likely to be associated with employee A (see on the right part of the graph below the two points are close to one another) whereas "Address" type errors are more likely to be associated with employee C (the two points are visually close on the left part of the graph). This is the same conclusion we found using the Chi-square test.
How Can You Use Qualitative Data?
Counts of qualitative data may obviously be used to provide relevant information to decision takers, process owners, quality professionals etc., and several graphical or statistical tools are available for that in Minitab. Our statistical software includes statistical tools that are useful to analyze qualitative values, but that I didn't have space to present in this short blog (for example, Kappa studies, Attribute sampling inspection, Nominal Logistic regression...).
Quantitative analysis and statistics might still be used more extensively in the service sector to improve quality and customer satisfaction. Of course, analyses of qualitative data are also often performed in the manufacturing industry. If you're not already using it, please download our free 30-day trial and see what you can learn from your data!