


The value of analyzing data is well established in industries like manufacturing and mining, but data-driven process and quality improvement is increasingly being adopted in service industries like retail sales and healthcare, too. In this blog post, I'll discuss how a simple data analysis may be used to improve processes in the service sector.
Suppose we want to improve the way incoming calls are processed in a call center run by a large insurance company. We are interested in analyzing duration metrics, which are very useful in assessing both the experience of customers—who always appreciate quick processing of incoming calls—and issues of employee productivity, such as which tasks are the most difficult to deal with.
If two customers call with exactly the same objective, process durations will certainly differ, because each employee will process the calls in a slightly different way. In addition, the customers may react differently to questions asked by the call center operator, and many other factors can influence the duration of the call.
Collecting Process Data
The process map below illustrates the 12 sequential steps involved in processing the incoming calls in this example.
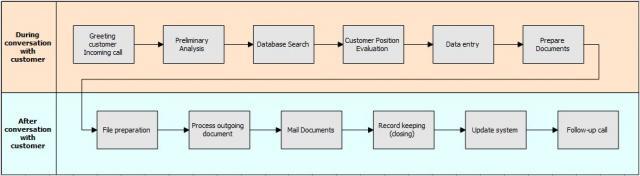
Some tasks are performed during the one-to-one conversation with the customer (Preliminary analysis, Database search, Data Entry …), and other tasks are done immediately after the phone call, while the customer is waiting to receive the final document.
The task durations have been measured for each step of each call received, over a reasonable period of time. Our objective is to transform this large quantity of raw data into useful information, and to calculate summary statistics.
We are interested in analyzing the amount of variability in the time it takes to complete each task. We would like to better understand which steps in this process generate the largest amount of variability.
Using Quartile Summary Statistics to Analyze Variability
Analyzing variability using quartile summary statistics may play an important role in benchmarking. For example, we can seek to understand if there are large differences in processing times for a particular step, and then gain an insight into what accounts for the differences. Is the task duration affected by having more experienced operators, different levels of knowledge, or better practices?
Quartiles represent the value for which 25% of the data is below (Q1) and the value for which 25% of the data is above (Q3). The Interquartile Range (IQR) is the difference between these two quartiles (Q3 – Q1 = IQR). A major advantage of using the Interquartile Range (IQR) to estimate variability is that it is much less sensitive to outliers than the variance or the Standard Deviation summary statistics.
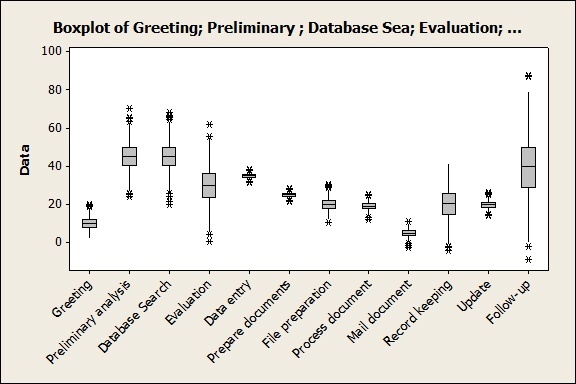
The Box Plot below shows the Q3 values (upper bounds of the boxes) for each of the twelve process steps, as well the Q1 values (lower bounds of the boxes) and the outliers which are indicated by asterisks beyond the whiskers. The height of the rectangular boxes for each group represent the middle 50% (interquartile ranges) of the data.
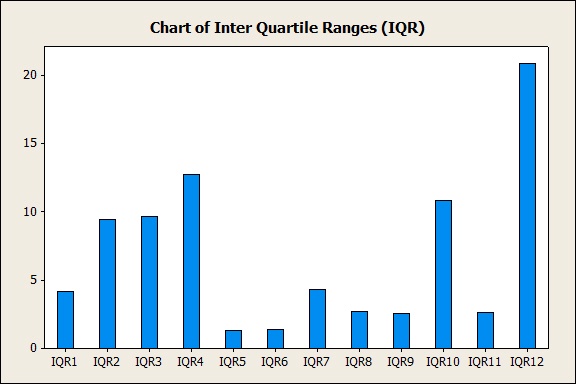
Minitab Statistical Software has been used to compute the IQR values for the 12 steps and display them on the bar chart graph below.
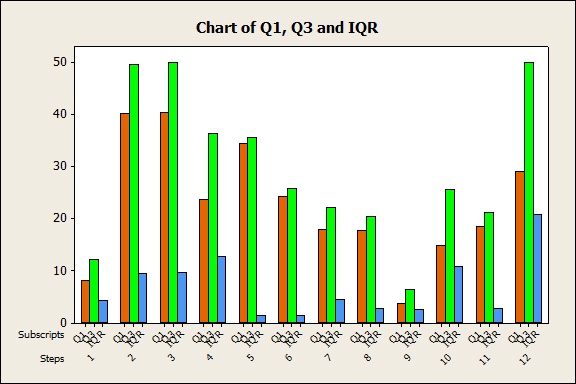
Q1 (the first quartile), Q3 (the third quartile) and the IQR for the 12 process steps are shown in the bar chart below.
You can see that the IQR is much larger for the follow-up calls (12th step). The IQRs are also large for the 2nd, 3rd and 4th steps (Preliminary analysis, Database search and Evaluation) during the initial conversation and for the 10th step (Recordkeeping) after the one-to-one conversation. Because the differences for these specific tasks are significant, we might have an opportunity to reduce durations.
These variations might be due to different levels of knowledge for the more complex tasks. Can we set best practices for these tasks ? Can we identify what the best practices are ? Do we need to standardize the way follow-up calls are carried out ? Do we need to redefine what we expect from a follow-up call ? Could the large differences for the database search and for the record keeping tasks be due to different levels of knowledge of the customer relations management (CRM) database? Perhaps not all employees feel comfortable using the company CRM system.
Now that we've identified the tasks with the most potential for improvement, we can begin to see which factors might have the most influence on the variation we've seen.
If you'd like to try this yourself, download the Minitab project file here.
The Power of Quartile Statistics
Quartile statistics possess a great deal of analytical power and are a very useful technique for benchmarking purposes. These statistics are used less often in the service sector than in manufacturing, but more and more businesses are learning how even very simple summary statistics such as quartiles can help you identify the steps that can easily be improved.