Businesses are getting more and more data from existing and potential customers: whenever we click on a web site, for example, it can be recorded in the vendor's database. And whenever we use electronic ID cards to access public transportation or other services, our movements across the city may be analyzed.
In the very near future, connected objects such as cars and electrical appliances will continuously generate data that will provide useful insights regarding user preferences, personal habits, and more. Companies will learn a lot from users and the way their products are being used. This learning process will help them focus on particular niches and improve their products according to customer expectations and profiles.
For example, insurance companies will monitor how motorists are driving connected cars, to adjust insurance premiums according to perceived risks, or to analyze driving behaviors so they can advise motorists how to boost fuel efficiency. No formal survey will be needed, because customers will be continuously surveyed.
Let's look at some statistical tools we can use to create and analyze user profiles, map expectations, study which expectations are related, and so on. I will focus on multivariate tools, which are very efficient methods for analyzing surveys and taking into account a large number of variables. My objective is to provide a very high level, general overview of the statistical tools that may be used to analyze such survey data.
A Simple Example of Multivariate Analysis
Let us start with a very simple example. The table below presents data some customers have shared about their enjoyment of specific types of food :

A simple look at the table does not really help us easily understand preferences. So we can use Simple Correspondence Analysis, a statistical multivariate tool, has been used to visually display expectations.
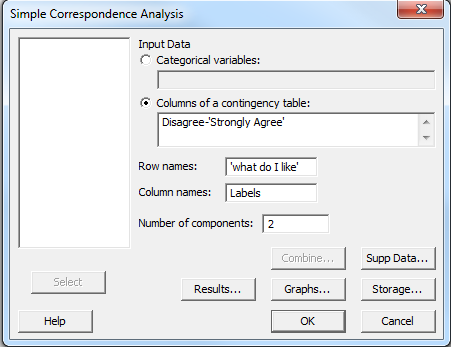
In Minitab, go to Stat > Multivariate > Simple Correspondence Analysis... and enter your data as shown in the dialogue box below. (Also click on "Graphs" and check the box labeled "Symmetric plot showing rows and columns.")
Minitab creates the following plot:
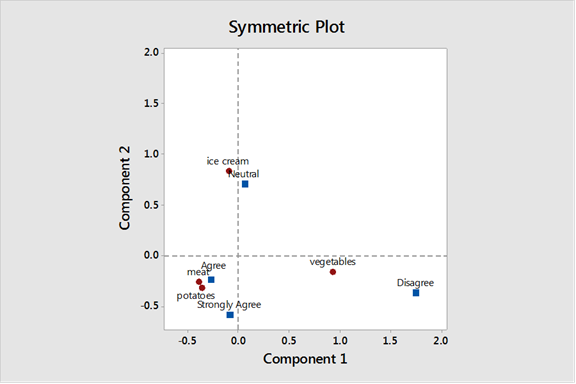
Looking at the plot, we quickly see that vegetables tend to be associated with “Disagree” (positioned close to each other in the graph) and Ice cream is positioned close to “Neutral” (they are related to each other). As for Meat and Potatoes, the panel tends either to “Agree” or “Strongly agree.”
We now have a much better understanding of the preferences of our panel, because we know what they tend to like and dislike.
Selecting the Right Type of Tool to Analyze Survey Data
Many multivariate tools are available, so how can you choose the right one to analyze your survey data?
The decision tree below shows which method you might choose according to your objectives and the type of data you have. For example, we selected correspondence analysis in the previous example because all our variables were categorical, or qualitative in nature.
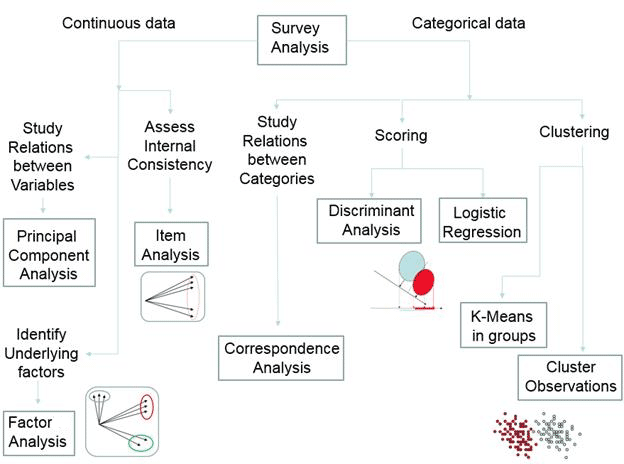
Categorical Data and Prediction of Group Membership (Right Branch)
Clustering
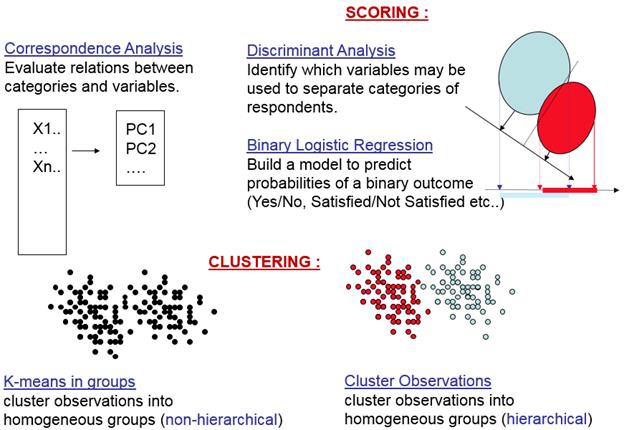
If you have some numerical (or continuous) data and you want to understand how your customers might be grouped / aggregated (from a statistical point of view) into several homogeneous groups, you can use clustering techniques. This could be helpful to define profiles and user groups.
Discriminant Analysis or Logistic Regression (Scoring)
If your individuals already belong to different groups and you want to understand which variables are important to define an existing user group, or predict group membership for new individuals, you can use discriminant analysis, or binary logistic regression (if you only have two groups).
Correspondence Analysis
As we saw in the first example, correspondence analysis lets us study relationships between variables that are categorical / qualitative.
Numeric or Continuous Data Analysis (Left Branch)
Principal Component Analysis or Factor Analysis
If all your variables are numeric, you can use principal components analysis to understand how variables are related to one another. Factor analysis may be useful to identify an underlying, unknown factor associated to your variables.
Item Analysis
This tool was specifically created for survey analysis. Do the items of a survey evaluate similar characteristics? Which items differ from the remaining questions The objective is to assess internal consistency of a survey.
They are computationally intensive, but performing these multivariate analyses in Minitab is very user-friendly, and the software produces easy-to-understand graphs (as in the food preference example above).
A Closer Look at Some Specific Multivariate Tools
Let's take a closer look at the tools for numerical survey data analysis. The graph below shows the tools that are available to you and their objectives in each case. These methods are often used to group numeric variables according to similarity, they may also be useful in studying how individuals are positioned according the main groups of variables in order to identify user profiles.
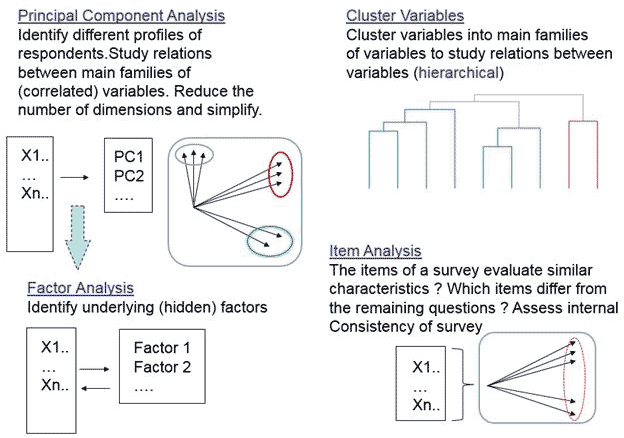
And now let's look a bit more closely at the tools we can use for analyzing categorical survey data. Again, the diagram below shows the tools that are available to you and their objectives. Many of these tools can be used to study how numeric variable relate to qualitative categories.
Conclusion
This is a very general overview of multivariate tools for survey analysis. If you want to go deeper and learn more about these techniques, you can find some resources on the Minitab web site, in the Help menu in Minitab's statistical software, or you can contact our technical support team.


