


 – This blog was co-written by Minitab Area Marketing Manager Abbie Wong.
When the effects of COVID-19 caused medical device shortages worldwide, many manufacturers rushed to pivot their production lines to meet demand. Although the United States Food and Drug Administration (FDA) temporarily loosened guidelines for some products like hand sanitizer, there is still a standard approval path medical device manufacturers follow in order to bring their products to market.
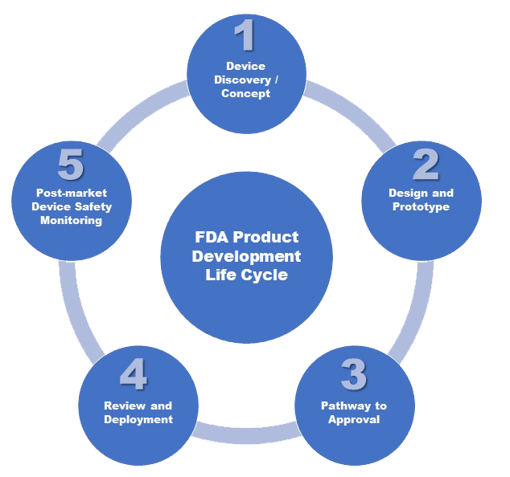
Today we are going to explore the five stage goals recommended by the FDA and a few examples of the statistical techniques typically conducted within them.
Stage 1: Device Discovery and Concept
You have probably heard necessity is the mother of invention. As with many new products and innovation in general, medical device manufacturers often start a project and move it through the FDA stage goals because they see an unmet need. From a pacemaker to a pill with a camera inside it, all medical devices start with a proof of concept, where R&D engineers and technicians verify if the concept is practical.
Sometimes you might have a few similar products (or maybe the same product but using different materials). You can plug your data on reliability, consistency and many other factors into Minitab’s Variability Chart to help decide which is the best product to move forward with.
See These and Several Other Examples On-Demand

Stage 2: Design and Prototype
At this stage, researchers build an early version of a medical device – not for human use, but to test in controlled laboratory settings. As they refine the prototype, they continue to learn more about the product’s potential use for people and how to reduce risk of harm.
Example: Predicting Product Life Cycle Using Accelerated Life Testing
Some products, such as implantable medical devices, tend to last for many years. For that reason, every medical device must be labeled with an expiration date that is supported by shelf-life data.
To collect failure data, researchers can apply Minitab’s Accelerated Life Testing (ALT) techniques. ALT is when a product is forced to fail more quickly under extreme conditions such as high temperature or high pressure. Pushing the product to fail more rapidly reduces the test time required. Failure data is then analyzed to extrapolate the product life cycle under normal circumstances.
Stage 3: Pathway to Approval
The pathway to approval for a medical device depends on its risk classification (Class I, Class II or Class III). Each device is assigned its class based on the level of control necessary to provide reasonable assurance of its safety and effectiveness. The FDA’s website provides detailed descriptions on how devices are classified and the testing and validation required for each class, but to illustrate it simply – Class I can be simple devices like bandages, latex gloves and electric toothbrushes while Class III are usually life-sustaining, like the implantable medical devices in the previous example.
In this stage, a batch of products is manufactured and tested to see its performance relative to specifications.
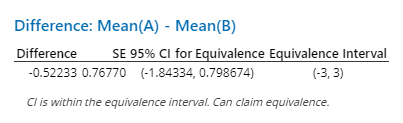
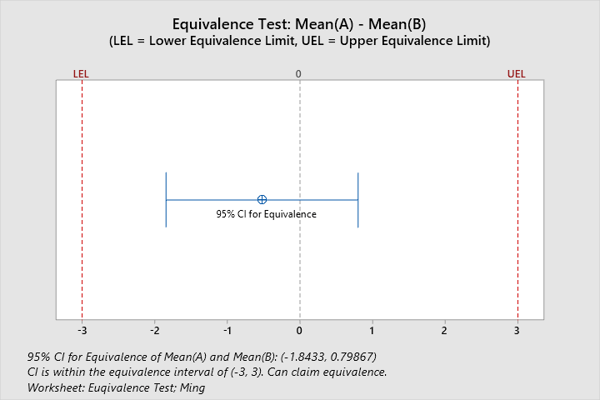
Example: Confirming 2 Devices Are Equivalent with Equivalence Testing
Statistical equivalence testing may be used to assess whether two medical devices are equivalent. Equivalence testing is an analytical approach to provide evidence of equivalence. In performing an equivalence test, the traditional null and alternative hypotheses are reversed, meaning the null hypothesis is that two devices are not equivalent (i.e., the difference between them is vast). The alternative hypothesis is that they are the same. For example, researchers want to determine if two types of intravenous access devices deliver an equivalent amount of fluid. They define the zone of scientific equivalence as a mean difference in infusion amount of 3 mL or less. From the Minitab Equivalence Test, researchers can be 95% confident that the difference in mean infusion amount is between -1.84334 and 0.798674 ml. Because the 95% confidence interval falls between -3 and 3 (zone of scientific equivalence), the two IV devices are equivalent for infusion amounts:
Stage 4: FDA Review and Deployment
In this stage, we are getting ready to file an application to the FDA so that we can market the device to the public. We want to demonstrate that we have sufficient and acceptable information on the device’s safety and effectiveness. We monitor the process to make sure it’s stable and double-check we are making the product within specification limits.
One way to improve a medical device manufacturing process is to implement a statistical process control (SPC) program. Typically used in mass production, an SPC program enables a company to continually release a product using control charts, a specialized time series plot designed to help identify abnormal patterns of variability in a process, rather than inspecting individual batches of a product.
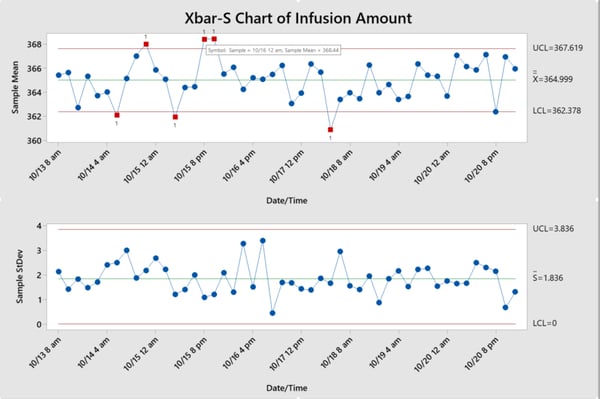
Example: Checking for changes in intravenous access device infusion amounts
Five intravenous devices are randomly selected from each lot for approximately one week. The infusion amount is measured. From the control charts below, engineers can identify which batches are out of control. By checking the corresponding log files, they can identify and eliminate all special cause variation. A successful SPC program helps manufacturers maintain stable processes, improve efficiency, and reduce costs, as seen below.
Stage 5: Post-Market Safety Monitoring
Now that the product has been released, we are going to monitor the production line properly to make sure it is properly maintained and assure the process remains in a constant state of control. In this stage of post-market surveillance, we also ensure any adverse events, such as device failures or malfunctions, are reported and addressed. The FDA carries out manufacturer inspections and employs reporting programs that allow manufacturers, health professionals and consumers to report problems.
Example: Designing a preventative maintenance schedule using reliability analysis
This stage involves providing an adequate level of service and limiting downtime of devices in the facility. One form of maintenance is preventative maintenance (PM), which is a scheduled event. PMs are scheduled according to the risk ranking of the medical device at different times. Minitab’s reliability shelf-life studies and multiple failure mode analysis helps manufacturers calculate the risk of failure at a different time of the life cycle for the whole product and each component within the product. Engineers may then design the maintenance schedule according to the probability of failure at different stages of the life cycle.
Wrapping Up
Medical device manufacturers must ensure the quality and durability in each of the five stages of the product life cycle, and document it in detail. Hopefully these examples of Minitab’s broad range of analytical tools can help you to understand and move through each step of the product life cycle.
Related: More In-Depth Details on Each of the 5 FDA Stages

See how our experts can help you optimize your medical device manufacturing. Learn more about our Training Services today!