


"You take 10 parts and have 3 operators measure each 2 times."
This standard approach to a Gage R&R experiment is so common, so accepted, so ubiquitous that few people ever question whether it is effective. Obviously one could look at whether 3 is an adequate number of operators or 2 an adequate number of replicates, but in this first of a series of posts about "Gauging Gage," I want to look at 10. Just 10 parts. How accurately can you assess your measurement system with 10 parts?
Assessing a Measurement System with 10 Parts
I'm going to use a simple scenario as an example. I'm going to simulate the results of 1,000 Gage R&R Studies with the following underlying characteristics:
- There are no operator-to-operator differences, and no operator*part interaction.
- The measurement system variance and part-to-part variance used would result in a %Contribution of 5.88%, between the popular guidelines of <1% is excellent and >9% is poor.
So—no looking ahead here—based on my 1,000 simulated Gage studies, what do you think the distribution of %Contribution looks like across all studies? Specifically, do you think it is centered near the true value (5.88%), or do you think the distribution is skewed, and if so, how much do you think the estimates vary?
Go ahead and think about it...I'll just wait here for a minute.
Okay, ready?
Here is the distribution, with the guidelines and true value indicated:
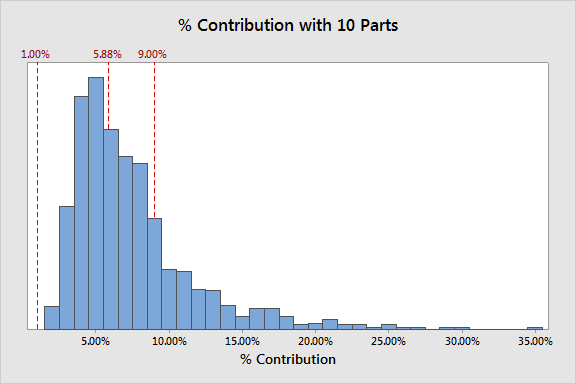
The good news is that it is roughly averaging around the true value.
However, the distribution is highly skewed—a decent number of observations estimated %Contribution to be at least double the true value with one estimating it at about SIX times the true value! And the variation is huge. In fact, about 1 in 4 gage studies would have resulted in failing this gage.
Now a standard gage study is no small undertaking—a total of 60 data points must be collected, and once randomization and "masking" of the parts is done it can be quite tedious (and possibly annoying to the operators). So just how many parts would be needed for a more accurate assessment of %Contribution?
Assessing a Measurement System with 30 Parts
I repeated 1,000 simulations, this time using 30 parts (if you're keeping score, that's 180 data points). And then for kicks, I went ahead and did 100 parts (that's 600 data points). So now consider the same questions from before for these counts—mean, skewness, and variation.
Mean is probably easy: if it was centered before, it's probably centered still.
So let's really look at skewness and how much we were able to reduce variation:
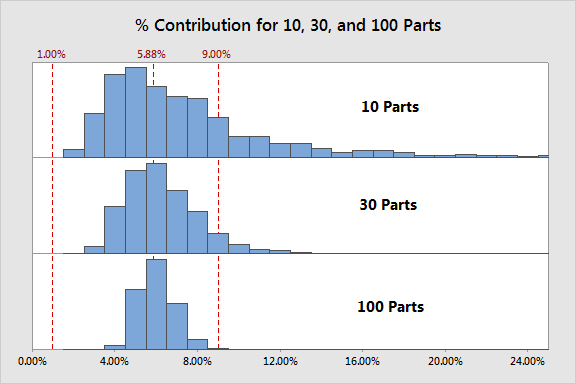
Skewness and variation have clearly decreased, but I suspect you thought variation would have decreased more than it did. Keep in mind that %Contribution is affected by your estimates of repeatability and reproducibility as well, so you can only tighten this distribution so much by increasing number of parts. But still, even using 30 parts—an enormous experiment to undertake—still results in this gage failing 7% of the time!
So what is a quality practitioner to do?
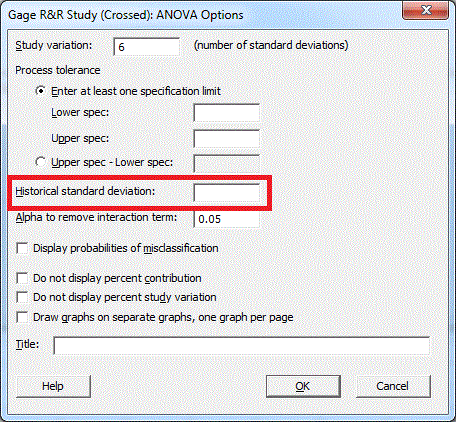
I have two recommendations for you. First, let's talk about %Process. Often times the measurement system we are evaluating has been in place for some time and we are simply verifying its effectiveness. In this case, rather than relying on your small sampling of parts to estimate the overall variation, you can use the historical standard deviation as your estimate and eliminate much of the variation caused by the same sample size of parts. Just enter your historical standard deviation in the Options subdialog in Minitab:
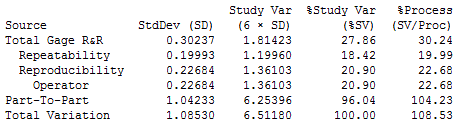
Then your output will include an additional column of information called %Process. This column is the equivalent of the %StudyVar column, but using the historical standard deviation (which comes from a much larger sample) instead of the overall standard deviation estimated from the data collected in your experiment:
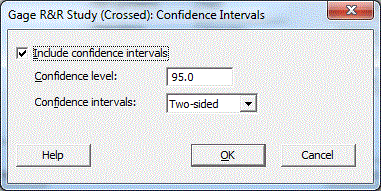
My second recommendation is to include confidence intervals in your output. This can be done in the Conf Int subdialog:
Including confidence intervals in your output doesn't inherently improve the wide variation of estimates the standard gage study provides, but it does force you to recognize just how much uncertainty there is in your estimate. For example, consider this output from the gageaiag.mtw sample dataset in Minitab with confidence intervals turned on:
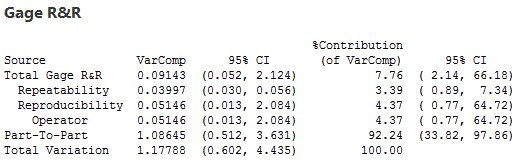
For some processes you might accept this gage based on the %Contribution being less than 9%. But for most processes you really need to trust your data, and the 95% CI of (2.14, 66.18) is a red flag that you really shouldn't be very confident that you have an acceptable measurement system.
So the next time you run a Gage R&R Study, put some thought into how many parts you use and how confident you are in your results!