


Do you prefer ketchup or soy sauce?
If someone asked you this question, your answer would likely depend upon what you were eating. You probably wouldn't dunk your spicy tuna roll in ketchup. And most people (pregnant moms-to-be excluded) don't seem to fancy eating soy sauce with hot French fries.
A Common Error When Using ANOVA or DOE to Assess Factors
Modeling techniques such as ANOVA or Design of Experiments (DOE) can determine if factors of interest impact a process. For example, you may want to evaluate how various time and temperature settings affect product quality. Or you may want to determine what factors influence loan processing time, or customer satisfaction, or the bottom line.
So you collect data about your factors of interest, and now you're ready to do your analysis. This is where many people make the unfortunate mistake of looking only at each factor individually.
In addition to considering how each factor impacts your response variable, you also need to evaluate the interaction between those factors and determine if any of those are significant as well. And much like your preference for ketchup versus soy sauce depends upon what you’re eating, optimum settings for a given factor will depend upon the settings of another factor when an interaction is present.
How to Evaluate and Interpret an Interaction
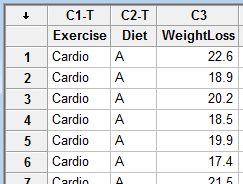
Let’s use a weight loss example to illustrate how we can evaluate an interaction between factors. We're evaluating 2 different diets and 2 different exercise programs: one focused on cardio and one focused on weight training. We want to determine which result in greater weight loss. We randomly assign participants to either diet A or B and either the cardio or weight training regimen, and then record the amount of weight they’ve lost after 1 month.
Here is a snapshot of the data, which you can download here:
To evaluate the effect of multiple factors on a continuous response, we can use Stat > ANOVA > General Linear Model in Minitab Statistical Software, which yields the following results for our data:
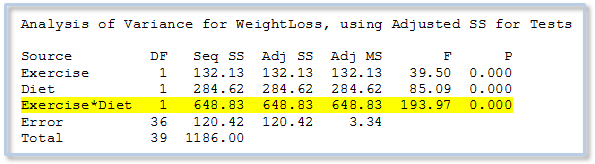
We can see that the p-value for the Exercise*Diet interaction is 0.000. Because this p-value is so small, we can conclude that there is indeed a significant interaction between Exercise and Diet. So which diet is better? Our data suggest it’s like asking “ketchup or soy sauce?” The answer is, "It depends."
Since the Exercise*Diet interaction is significant, let’s use an interaction plot to take a closer look:
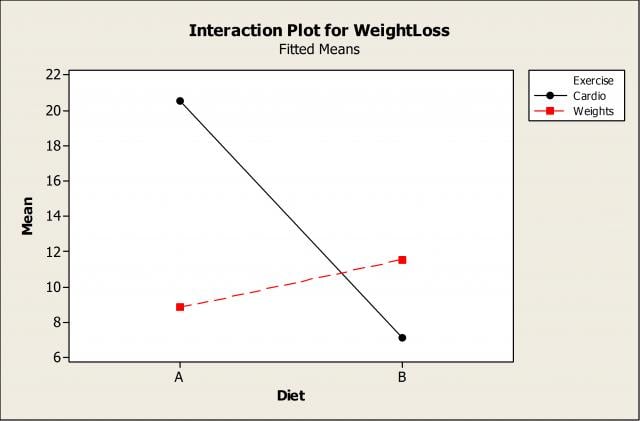
For participants using the cardio program (shown in black), we can see that diet A is best and results in greater weight loss. However, if you’re following the weight training regimen (shown in red), then diet B is results in greater weight loss than A.
The Danger of Ignoring Interactions Among Factors
Suppose this interaction wasn't on our radar, and we instead focused only on the individual main effects and their impact on weight loss:
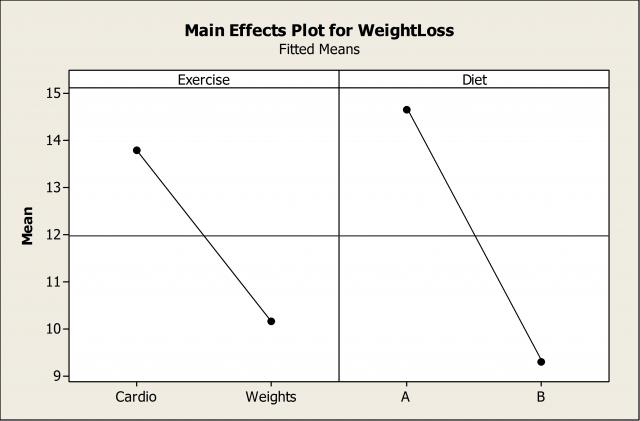
Based on this plot, we would incorrectly conclude that diet A is better than B. As we saw from the interaction plot, that is only true IF we’re looking at the cardio group.
Clearly, we always need to evaluate interactions when analyzing multiple factors. If you don't, you run the risk of drawing incorrect conclusions...and you might just get ketchup with your sushi roll.
[Note: The data used here was for example purposes only and was not based on a real study.]