Adhering to the proper assumptions in any statistical analysis is very important. And there seems to be an assumption for everything. For this post, I’d like to clear up some confusion about one particular assumption for assessing normality.
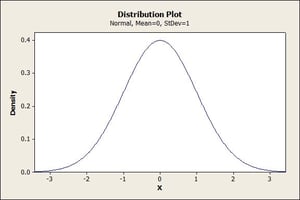
A data set is normally distributed when the data itself follows a uni-modal bell-shaped curve that is symmetric about its mean. This graph, created from the Probability Distribution Plot in Minitab Statistical Software, shows a normal distribution with a mean of 0 and a standard deviation of 1:

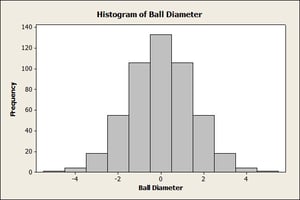
In the case of running a normality test, the key assumption for the data is that it is continuous. When a data set is continuous, there is an infinite amount of values between any two numbers in that data set. If someone asked you to count all of values in any given continuous data set, you couldn’t. Height is a pretty common example of a continuous variable. Only a measurement system like a scale is relegating me to being 5.8 feet tall. If the scale had a precision of up to 15 places beyond the decimal, then we can be a little bit more exact about how tall I am. The sheer option of being able to go that far makes it continuous. This assumption can be forgotten when one is simply concerned with how the data visually looks. Let’s say that a person needs to perform a capability analysis on the diameter of ball bearings. Here is a look at that person’s data before the test is performed to see if the data is normally distributed:

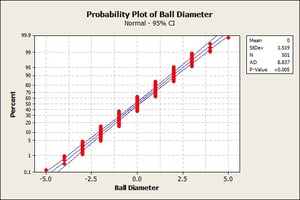
The graph seems to be normally distributed, so it should pass the normality test right? Here’s our Normality Test:

The p-value is less than 0.05, which leads us to reject the null hypothesis that the data comes from a normal distribution. What happened? Well, we ask the person to give us a little more information about said data set. We find out that that the data is in fact discrete, not continuous. He says that there is no way to output a value between two integers. This is not simply due to the imprecision of the measurement tool; no such value between integers exists for the domain he is working in.
The underlying assumption, before performing a normality test, is that the data is continuous. When viewing discrete data, you lack information between any two integer values. This loss of information can make it hard to assess normality, i.e. that the underlying distribution really does resemble a bell curve with a specific mean and standard deviation. This bell curve assumes that you are looking at values between integers as well. Although it can make for a really nice histogram, it can make for disastrous results when performing a normality test.
There is a chi-square test that can be used to assess normality on frequency tables. One might construe this as having the ability to analyze discrete data, as the data itself would be in summarized, tabular format. This chi-square test is still assuming that the binned data, or data coming from a frequency table, is being derived from the original continuous data set. The test statistic is actually very dependent on sufficient sample size and how the data is binned. Fortunately, we do have a macro for performing this test, and it can be found here:
http://support.minitab.com/minitab/17/macros/macros-files/analysis-of-counts-macros/sortchi/
It’s important to fully understand what requirements are for an analysis before conducting it. Not taking your assumptions seriously wouldn’t be the “normal” thing to do!


