I’ll leave most of the sports talk to Kevin, but I knew there would come a time when I’d be curious enough to use Minitab Statistical Software to analyze the data behind my favorite sport—NASCAR auto racing. If you watch NASCAR, you probably know that Dale Earnhardt, Jr. is the most popular driver, despite his winless streak of over 120 races.
A lot has been done in the last few years to get Dale Jr. back where he was in 2004 when he won six races and finished fifth in the Sprint Cup Series point standings. One of those things was a move in 2008 from his father’s company—Dale Earnhardt, Inc. (DEI) —to a new team and owner with Hendrick Motorsports.
Car owners and teams mean a lot for the success of a driver. Established teams like Hendrick have more money to afford better engines and technology, as well as to supply a better-skilled and larger team of crew chiefs and pit crew members.
Dale Jr. is in good company with Hendrick’s winning drivers and top-notch equipment; however, he’s still posting lack-luster finishes. I’m wondering: Was Dale Jr.’s average finish higher before he drove for Hendrick Motorsports?
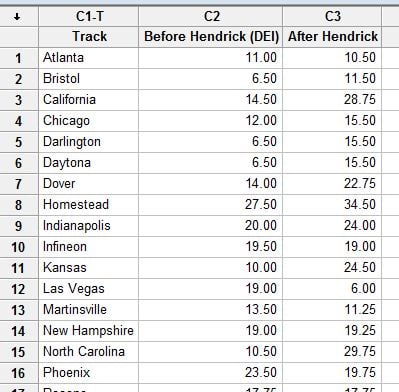
To figure this out, I used a Minitab worksheet to compile Dale Jr.'s average finish at the following tracks before and after he had Hendrick as an owner:

(I didn’t use data from the 2011 season because the season is still in progress.)
Just by glancing at these stats, you can tell that Dale Jr. has had a hard time improving his average race finish after joining Hendrick Motorsports. For a deeper analysis, the data in this case lends itself nicely to a paired t-test.
A paired t-test tests whether or not the mean difference between paired observations is significant. Paired t-tests come in handy especially if you're comparing means from “before” and “after” data.
For example, you might use a paired t-test to analyze data such as:
- Weights recorded for individuals before and after an exercise program
- Ratings of competing products from a single evaluator
Here, I’m looking to find a significant difference between Dale Jr.’s average finish before and after he joined Hendrick. In Minitab, I chose Stat > Basic Statistics > Paired t:

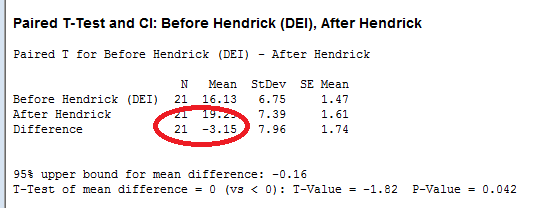
The Minitab output confirmed that there is a significant mean difference between Dale Jr.’s finishes before and after he joined Hendrick (p-value < .05). The output shows the grim reality—Dale Jr.’s average finish was 3 spots higher before he joined Hendrick.
While Dale Jr. is still my favorite racer, I guess his performance indicates that driving for a top team owner might not yield winning results—at least not right away.
Stay tuned for another NASCAR-related blog! Next time, I’ll look at how a driver’s starting position might impact his finishing position.
Thanks to Kevin for his help on this post!


