


The DMAIC methodology for completing quality improvement projects divides project work into five phases: define, measure, analyze, improve, and control. It’s also probably the most well-known and most used project methodology for projects that focus on improving an existing process. (Many other methodologies exist, such as DMADV, which focuses on using quality improvement techniques to create a new product of process design.)
Franciscan Hospital for Children, a hospital in Brighton, Mass., that specializes in the care of children with special health care needs, recently completed a project using the DMAIC methodology to increase the operating room efficiency of dental surgeries. It’s a great example of successfully using DMAIC in healthcare. So how did they do it? Read on.
Improving the Capacity of Dental Operating Rooms
Recognizing the opportunity to grow a key area of service, the hospital’s quality improvement team chose to focus efforts on the dental division, where the dental surgeries were not occurring as efficiently as possible. Previous analysis and studies done to assess capability indicated that the facility was capable of completing 12 surgeries per day, but it currently had an average daily rate of only 8.7 surgeries. The hospital team’s goal was to meet a daily average of 12 surgeries.
As part of the ‘define’ phase of the DMAIC approach, the team involved staff representatives from the nursing, scheduling, registration, and anesthesiology departments. They developed process maps to help them better understand current processes for scheduling, registration, and surgery preparation, and to get insight into the factors affecting each process. They were able to narrow down both internal and external contributors to cancellations and no-shows, as well as idle time that occurred due to process bottlenecks. The team then prioritized factors for further investigation—directing their attention to the analysis of variables they could control.
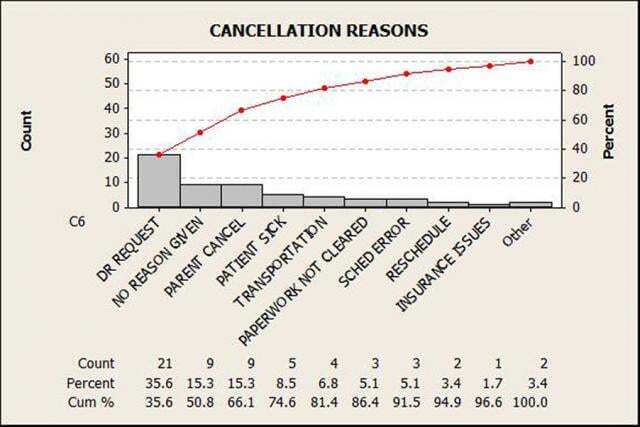
For example, the hospital team compiled data and created a Pareto chart to analyze the reasons for cancellations. The Pareto analysis helped them determine which reason occurred most frequently, and aided them in understanding how daily cancellations affected overall cycle times and scheduling.
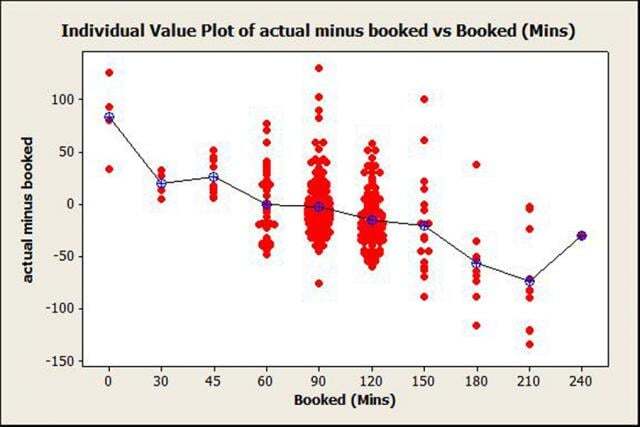
Individual Value Plots in Minitab helped the team view the distribution of actual procedure time and the time originally allotted for each procedure. They found that shorter procedures tended to exceed scheduled time, while longer procedures tended to finish earlier than scheduled. The graphs allowed the team to quickly view how much unused time occurred each day in each operating room.
Team members followed up with further analysis (the "analyze" phase) to understand other factors that contributed to unused time in the operating rooms, and used histograms to analyze turnaround times for procedures, noting significant variation in the times. They realized the opportunity to reduce both the variation and the average turnaround to allow for more time to do procedures.
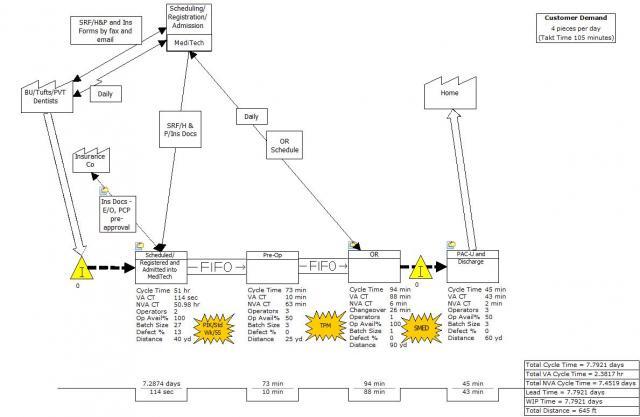
By analyzing the data and learning more about factors that negatively affect processes, the team was able to develop process changes, then test the effectiveness of improvements. They completed current state and future state Value Stream Maps in Engage to identify opportunities for improving the lead time and then began executing the new, leaner processes.
Results
Within two weeks of starting the improvement phase, average surgeries per day jumped from 8.7 to 9.9, and then to 11.2 during the control phase. At the same time, day-to-day utilization rates stabilized. The project also helped the team establish performance metrics that will be used to continually improve operating room capacity and utilization rates. By regularly plotting process data with control charts, staff can easily monitor for any unusual variation in the number of surgeries per day (the "control' phase").
Interested in learning more about quality improvement in healthcare? Check out these posts:
Lean Six Sigma in Healthcare: Improving Patient Satisfaction
How to Use Value Stream Maps in Healthcare