


Welcome to the Hypothesis Test Casino! The featured game of the house is roulette. But this is no ordinary game of roulette. This is p-value roulette!
Here’s how it works: We have two roulette wheels, the Null wheel and the Alternative wheel. Each wheel has 20 slots (instead of the usual 37 or 38). You get to bet on one slot.
What happens if the ball lands in the slot you bet on? Well, that depends on which wheel we spin. If we spin the Null wheel, you lose your bet. But if we spin the Alternative wheel, you win!
I’m sorry, but we can’t tell you which wheel we’re spinning.
Doesn’t that sound like a good game?
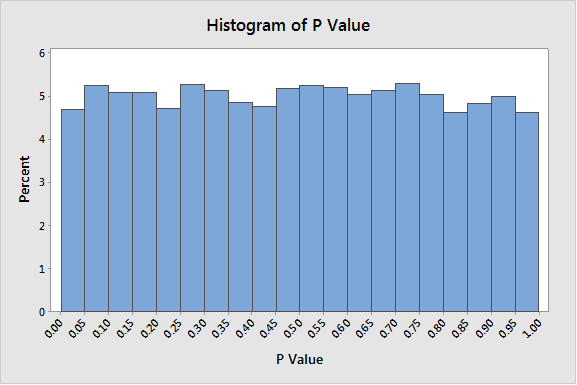
Not convinced yet? I assure you the odds are in your favor if you choose your slot wisely. Look, I’ll show you a graph of some data from the Null wheel. We spun it 10,000 times and counted how many times the ball landed in each slot. As you can see each slot is just as likely as any other, with a probability of about 0.05 each. That means there’s a 95% probability the ball won’t land on your slot, so you have only a 5% chance of losing—no matter what—if we happen to spin the Null wheel.
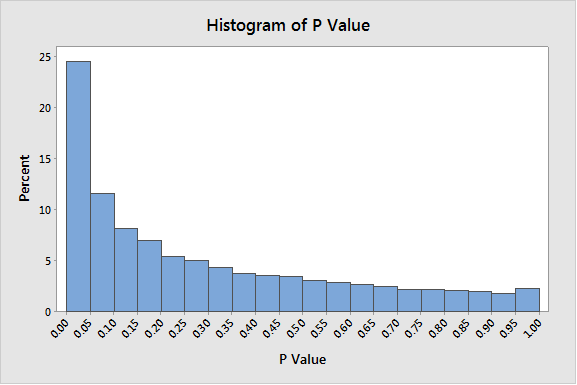
What about that Alternative wheel, you ask? Well, we’ve had quite a few different Alternative wheels over the years. Here’s a graph of some data from one we were spinning last year:
And just a few months ago, we had a different one. Check out the data from this one. It was very, very popular.
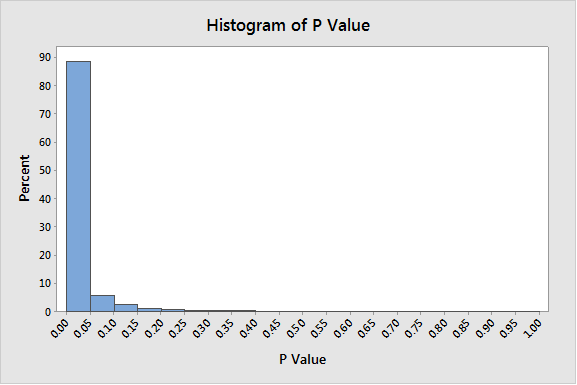
Now that’s what I call an Alternative! People in the know always picked the first slot. You can see why.
I’m not allowed to show you data from the current game. But I assure you the Alternatives all follow this same pattern. They tend to favor those smaller numbers.
So, you’d like to play? Great! Which slot would you like to bet on?
Is this on the level?
No, I don’t really have a casino with two roulette wheels. My graphs are simulated p-values for a 1-sample t-test. The null hypothesis is that the mean of a process or population is 5. The two-sided alternative is that the mean is different from 5. In my first graph, the null hypothesis was true: I used Minitab to generate random samples of size 20 from a normal distribution with mean 5 and standard deviation of 1. For the other two graphs, the only thing I changed was the mean of the normal distribution I sampled from. For the second graph, the mean was 5.3. For the final graph, the mean was 5.75.
For just about any hypothesis test you do in Minitab Statistical Software, you will see a p-value. Once you understand how p-values work, you will have greater insight into what they are telling you. Let’s see what we can learn about p-values from playing p-value roulette.
- Just as you didn’t know whether you are spinning the Null or Alternative wheel, you don’t know for sure whether the null hypothesis is true or not. But basing your decision to reject the null hypothesis on the p-value favors your chance of making a good decision.
- If the null hypothesis is true, then any p-value is just as likely as any other. You control the probability of making a Type I error by rejecting only when the p-value falls within a narrow range, typically 0.05 or smaller. A Type I error occurs if you incorrectly reject a true null hypothesis.
- If the alternative hypothesis is true, then smaller p-values become more likely and larger p-values become less likely. That’s why you can think of a small p-value as evidence in favor of the alternative hypothesis.
- It is tempting to try to interpret the p-value as the probability that the null hypothesis is true. But that’s not what it is. The null hypothesis is either true, or it’s not. Each time you “spin the wheel” the ball will land in a different slot, giving you a different p-value. But the truth of the null hypothesis—or lack thereof—remains unchanged.
- In the roulette analogy there were different alternative wheels, because there is not usually just a single alternative condition. There are infinitely many mean values that are not equal to 5; my graphs looked at just two of these.
- The probability of rejecting the null hypothesis when the alternative hypothesis is true is called the power of the test. In the 1-sample t-test, the power depends on how different the mean is from the null hypothesis value, relative to the standard error. While you don’t control the true mean, you can reduce the standard error by taking a larger sample. This will give the test greater power.
You Too Can Be a Winner!
To be a winner at p-value roulette, you need to make sure you are performing the right hypothesis test, and that your data fit the assumptions of that test. Minitab’s Assistant menu can help you with that. The Assistant helps you choose the right statistical analysis, provides easy-to-understand guidelines to walk you through data collection and analysis. Then it gives you clear graphical output to let you know how to interpret your p-value, while helping you evaluate whether your data are appropriate, so you can trust your results.