


If you teach statistics or quality statistics, you’re probably already familiar with the cuckoo egg data set.
The common cuckoo has decided that raising baby chicks is a stressful, thankless job. It has better things to do than fill the screeching, gaping maws of cuckoo chicks, day in and day out.
So the mother cuckoo lays her eggs in the nests of other bird species. If the cuckoo egg is similar enough to the eggs of the host bird, in size and color pattern, the host bird may be tricked into incubating the egg and raising the hatchling. (The cuckoo can then fly off to the French Riviera, or punch in to work at a nearby cuckoo clock, or do whatever it is that cuckoos with excess free time do.)
The cuckoo egg data set contains measurements of the lengths of cuckoo eggs that were collected from the nests of 5 different bird species. Using Analysis of Variance (ANOVA), students look for statistical evidence that the mean length of the cuckoo eggs differs depending on the host species. Presumably, that supports the idea that the cuckoo may adapt the length of its eggs to better match those of the host.
Old Data Never Dies..It Just Develops a Rich Patina
Sample data sets have a way of sticking around for awhile. The cuckoo egg data predate the production of the Model T Ford! (Apparently no one has measured a cuckoo egg in over 100 years. Either that or cuckoo researchers are jealously guarding their cuckoo egg data in the hopes of becoming eternally famous in the annals of cuckoology.)
Originally, the data was published in a 1902 article in Biometrika by OM Latter. LHC Tippet, an early pioneer in statistical quality control, included the data set in his classic text, the Methods of Statistics, a few decades later.
That's somewhat fitting. Because if you think about it, the cuckoo bird really faces the ultimate quality assurance problem. If its egg is recognized as being different (“defective”) by the host bird, it may be destroyed before it’s hatched. And the end result could be no more cuckoos.
Analyze the Cuckoo Egg Data in Statistical Software
Displaying boxplots and performing ANOVA is the classic 1-2 punch that’s often used to statistically compare groups of data. And that’s how this vintage data set is typically evaluated.
To try this in Minitab Statistical Software, click to download the data set. Then follow the instructions below.
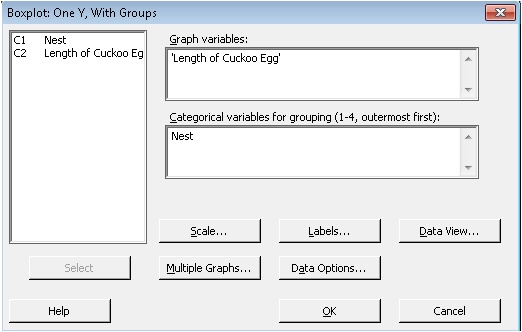
Display Side-by-Side Boxplots
- In Minitab, choose Graph > Boxplots. Under One Y, choose With Groups, then click OK.
- Fill out the dialog box as shown below, then click OK.
Minitab displays the boxplots
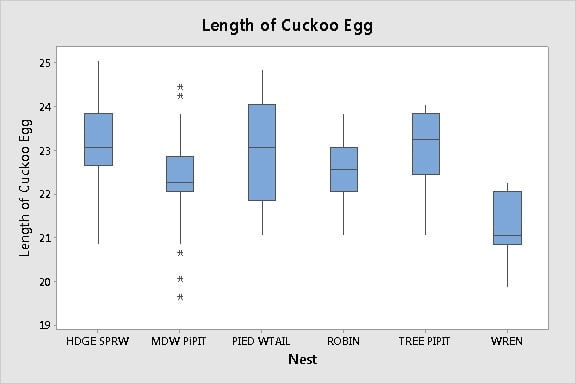
The boxplots suggest that the mean length of the cuckoo eggs may differ slightly among the host species. But are any of the differences statistically significant? The next step is to perform ANOVA to find out.
Perform One-Way ANOVA
- In Minitab, choose Stat > ANOVA > One-Way.
- Complete the dialog box as shown below.
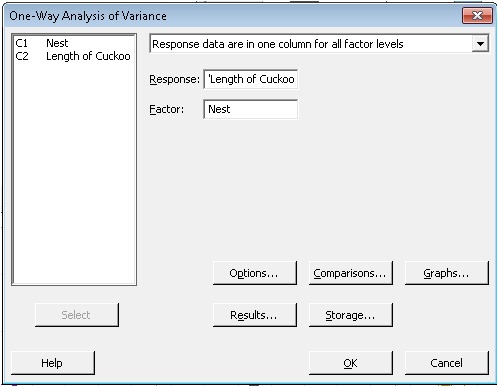
- Click Comparisons, check Tukeys, then click OK in each dialog box.
The ANOVA output includes the following results
Analysis of Variance
Source DF Adj SS Adj MS F-Value P-Value
Nest 5 42.94 8.5879 10.39 0.000
Error 114 94.25 0.8267
Total 119 137.19
Tukey Pairwise Comparisons
Grouping Information Using the Tukey Method and 95% Confidence
Nest N Mean Grouping
HDGE SPRW 14 23.121 A
TREE PIPIT 15 23.090 A
PIED WTAIL 15 22.903 A B
ROBIN 16 22.575 A B
MDW PIPIT 45 22.299 B
WREN 15 21.130 C
Means that do not share a letter are significantly different.
----------------------------------------------------
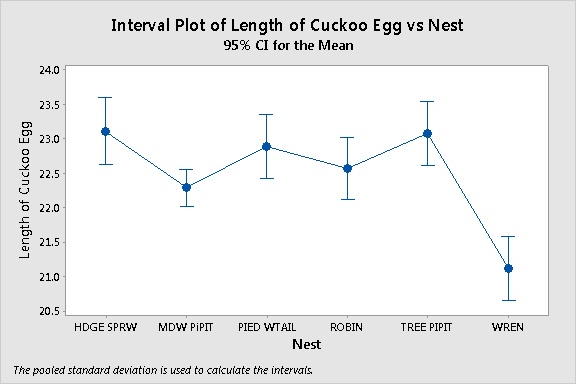
The interval plot displays the mean and 95% confidence interval for each group. In the ANOVA table, the p-value is less than the alpha level 0.05. So you reject the null hypothesis that the means do not differ.The egg lengths are statistically different for at least one group.
Based on Tukey's multiple comparisons procedure, two groups significantly differ. The mean length of the cuckoo eggs in the wren nest are significantly smaller than the eggs in all the other nests. The mean length of the eggs in the meadow pipit nest are significantly smaller than the eggs in the tree sparrow or tree pipit nests.
With that said, the case of the morphing cuckoo eggs is frequently considered closed. The ANOVA results are said to support the theory that the cuckoo adapts egg length to the host nest.
Bottom line: If you're a mother cuckoo, stay away from ostrich nests.
Post-Analysis Pondering
As alluring and sexy as a p-value is to the data-driven mind, it has its dangers. If you're not careful, it can act like a giant door that slams shut on your mind. Its air of finality may prevent you from looking more closely—or more practically—at your results.
Case in point: Most of us know that a wren is smaller than a robin. But what about the other bird species?
Personally, I wouldn’t recognize a pied wigtail or a tree pipit if it dropped a load of statistically significant doo-doo on my shiny bald head.
How big is each bird species—or more to the point, how long, on average, are its eggs? If two species have about the same size egg, then the lack of a significant difference in the ANOVA results would actually support the theory that the cuckoo may adapt its egg length to match the host. Without any indication of whether the lengths of the eggs of these bird species differ significantly to begin with and, if so, how they differ, it's really difficult to determine how ANOVA results will support or contradict the idea of egg-length adaptation by the cuckoo.
Apart from that, there's the issue of practical consequence. Upon closer examination of the confidence intervals, it appears that the actual mean difference itself could be fractions of a millimeter. Does that size difference really matter if you're a host bird? Would it make a difference between the eggs being accepted or rejected?
Finally, there's the proverbial elephant in the room whenever you perform a statistical analysis. The one that trumpets noisily in the back of an asymptotically conscientious mind: "Assssssumptions!! Asssssumptions!"
How well do the cuckoo egg data satisfy the critical assumptions for ANOVA?
Stay tuned for the next post.