


Design of experiments (DOE) is an extremely practical and cost-effective way to study the effects of different factors and their interactions on a response.
But finding your way through DOE-land can be daunting when you're just getting started. So I've enlisted the support of a friendly golden retriever as a guide dog to walk us through a simple DOE screening experiment.
Nala, the golden retriever, is shown at right. Notice how patiently she sits as her picture is being taken. She's a true virtuoso with the "Sit" command.
But "Lay Down" is another story...
Formulate the Objective
Although Nala knows the "Lay Down" command, she doesn't perform it quickly or consistently.
Why not? I decided to design a simple experiment to find out. The goal of this experiment is to screen potential factors and determine which ones, separately or in combination with each other, may be affecting her response to "Lay Down."
Note: The main point of this example is to illustrate the basic process of a DOE screening experiment—we'll talk about its shortcomings as an actual DOE application after the experiment.
Determine a List of Candidate Factors and the Measured Response
First determine a list of candidate factors, based on process knowledge, that you think are likely to affect the response of interest.
In this case, my dog is the process. Based on my knowledge of this "process," here are some factors that I think might influence the response.
| Factor | Levels | Description |
| Voice | Authoritative, Positive | The tone of voice used to give the command |
| Name | No, Yes | Saying her name before giving the lay-down command (or not) |
| Procedure | Sit-lay, Lay only | Having her sit before giving the lay-down command (or not) |
| Hand signal | No, Yes | Pointing to the ground when giving the command (or not) |
| Meal | Before, After | Performing the experiment when she's hungry or full |
| Flooring | Carpet, wood | The floor material she lays down on |
| Reward | Dry biscuit, fresh ham | Type of treat shown before and then given after the command |
There are 7 factors in this screening experiment. Each factor has only 2 levels. All the factors here are categorical, but in a real experiment you'd typically have numeric factors like Temperature (Low, High) or Speed (Slow, Fast) and so on.
The response is the number of seconds it takes the dog to lay down after being given the command, as measured on a stopwatch.
Understand the Basic Terminology
Because there only 2 levels for each factor, this experiment is called a 2-level factorial design.
A run of an experiment refers to each combination of factor settings at which the experiment is performed. For example, one run of this experiment is to give the "Lay Down" command using these settings.
| Voice | Name | Procedure | Hand signal | Meal | Location | Reward |
| Positive | No | Sit-Lay | Yes | Before | Wood | Fresh ham |
How many different unique runs are possible with 7 factors and 2 levels of each factor? If you remember your junior high school math, there are 2*2*2*2*2*2*2 = 27 = 128 possible combinations. So to perform the full experiment using all possible settings, I’d have to perform a total of 128 trials (runs).
My dog would certainly love that much attention. But I can’t invest that much time in the experiment (or that much money on honey-cured ham). Luckily, Minitab Statistical Software can help me pare down this experiment to make it more feasible.
Display and Compare Designs
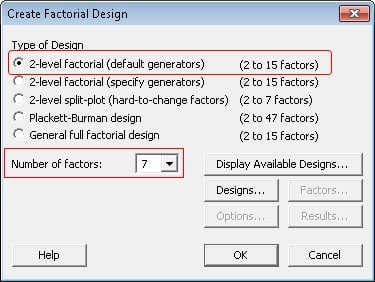
To choose a design for the experiment, in Minitab choose Stat > DOE > Factorial > Create Factorial Design. Recall that this is a 2-level factorial with 7 factors, so the dialog box is completed as shown below:
To see what designs are possible with the experiment, click Display Available Designs.
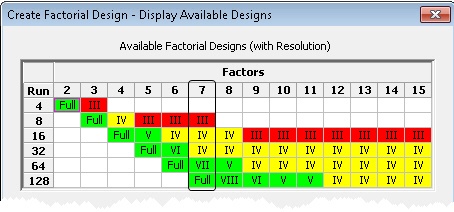
The table at the top of the dialog box summarizes possible designs for a 2-level factorial study. This experiment has 7 factors, so the available designs are listed under the 7 column.
There are 5 designs shown in the column. The Roman numeral for each design refers to its resolution. Roughly speaking, the resolution tells you how clearly you'll be able to "see" the effects of the experiment. Designs shaded in green provide the best resolution (from Resolution V to Full Resolution). Designs shaded in red provide the poorest resolution (Resolution III). Yellow indicates a mid-range resolution.
Full resolution allows you to see all the effects in your experiment. For lower resolutions, the Roman numeral (III, IV, or V) describes the extent that effects you're investigating will be "blurred together"—that is, confounded—with each other.
For this experiment, here's how the main effects (the effects from each single factor) are confounded with interactions between the factors at each resolution:
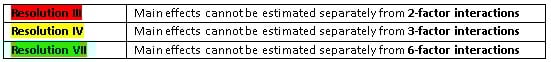
See the pattern in the table? For each resolution, the size of the interaction that's confounded with the main effects is one less than the resolution number. There are other confounded interactions as well. We'll talk more about these confounding patterns when we create the design in Part II.
For now, just be aware that the lower the resolution, the lower the size of the interaction that's confounded with the main effects, and the less clear your results will be. The red shading for Resolution III warns you that confounding main effects with 2-factor interactions is not something you want to do if you can avoid it.
Choose the Design
For each design, the number of runs required is shown in the far left column. For this experiment, the Full design requires 128 runs, just as we calculated above.The four other designs require fewer runs (64, 32, 16, and 8), but have lower resolutions.
Choose a design based on your available resources and the goal of your experiment. Using this dialog is a bit like comparison shopping to evaluate potential costs vs potential benefits/drawbacks.
For a given number of factors, the more runs you perform, the higher resolution you’ll get, but the more "expensive" the experiment becomes.
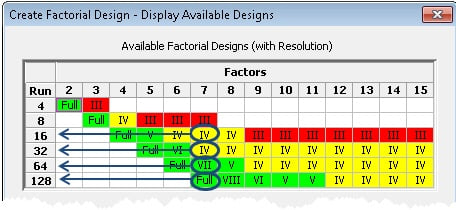
For example, although performing all 128 runs gives me Full Resolution, which is the best, I just can't afford to perform that many runs. Using half as many runs (64), I can get Resolution VII, which is still in the green range. But even that design is too costly for me.
Using 16 or 32 runs, I can get Resolution IV design. At this point, my goal is primarily to screen for significant main effects and simple 2-way interactions, so I'm going to save my pennies and go with a 16-run Resolution IV design. I've knocked down the "price" of my experiment from 128 runs to 16 runs--what a bargain!
Because my chosen design requires only 1/8 the number of runs as the full factorial design, it's called a 1/8 fractional factorial design.
Next time we'll create this 1/8 fractional factorial design in Minitab. We'll see how Minitab sets up the data collection worksheet and indicates confounding patterns in the design.
Unlike Nala, it does it all automatically—and without requiring a hunk of honey-cured ham.