


Despite the mountain of statistics backing the relative safety of air travel, I’m a nervous flyer.
If a plane hits turbulence, I turn a light shade of olive green and start panting like a sick dog. When I look around the plane compartment, everyone else seems bored and unconcerned.
Me? I’m clutching the arm rest, as 10,000 tiny ballerinas turn pirouettes in the pit of my stomach. It’s a visceral reaction that defies logic.
But it doesn’t help when I hear alarming reports, like the one the other week about the close call of two jets landing at the Detroit Metro airport.
The FAA reported that the snafu happened when an air traffic controller's headset began to give out. Pilots couldn’t hear their instructions and suddenly the jets breached the three-mile safety zone, as they approached the runway from different directions.
Thankfully, the pilots saw each other and avoided the risk of collision by flying over each other. A passenger on the 737 looked out the window and reported seeing the other plane just below them. Ultimately, no harm done.
But still. One faulty headset. Hundreds of lives in the air, literally. It’s mind boggling.
Quantifying Risk: The Key to Product Reliability
As our lives depend more and more on technology—from pacemakers to smartphones to automobiles to life support systems—the more we are adversely affected if a product or component we depend on fails. (Especially those of us with overactive sympathetic nervous systems!)
No wonder, then, that the reliability of products and their components is considered so critical by quality engineers.
To ensure the quality and safety of a product for consumers, it's imperative to clearly understand the risk of failure over its lifetime of use. Reliability/Survival analyses in Minitab provide critical tools to help you quantify this risk, including:
Probability Plots
This plot helps you visually assess the percentage of items expected to fail after given unit of time or cycle of use. It also helps you check whether your distribution model is appropriate--a critical assumption for reliability analysis.
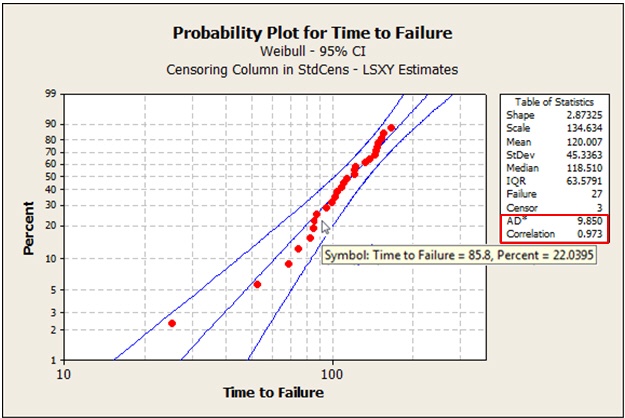
- The plotted points and the center line represent percentiles. The percentiles indicate the time at which you can expect a certain percent of the items to have failed, based on the observed values (points) and the fitted distribution (center line).
- To see the observed failure time and the estimated cumulative probability of failure for any data point, position your cursor over the point. In this example, you can expect 22% of items to fail after an elapsed time of about 86 months.
- You can also use the plot to evaluate the fit of your distribution model. The data points should fall along the fitted (center) line. A good distribution fit is also indicated by lower AD values and correlation values close to 1.
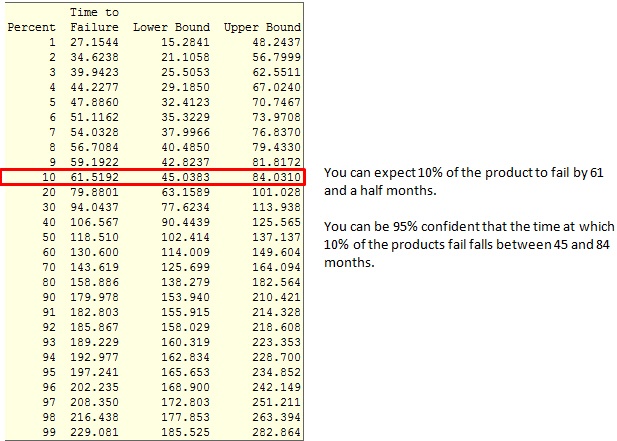
When you position your cursor over a line on the plot, Minitab displays a table of percentiles and confidence bounds for various percents of failure:
Survival Plots
The survival plot shows the reliability function of the product or component. Specifically, it tells you the probability that the item will still be working properly after a certain amount of time or usage. As you'd expect, the curve slopes downward over time, as the reliability of the product decreases with age.
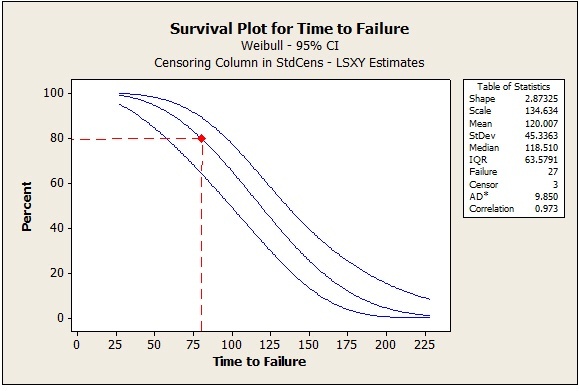
- The center line is the estimated reliability over time. In this example, there is an 80% chance that the product will last for at least 78 months.
- The left and right curved lines show the upper and lower 95% confidence bounds for the reliability values.
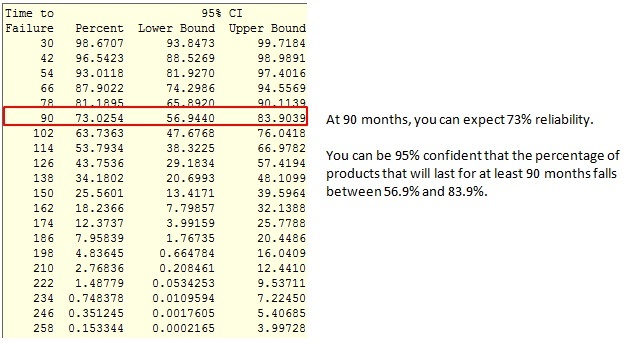
When you position your cursor over a curve on the plot, Minitab displays a table of reliability values and confidence bounds for various times to failure (or cycles to failure or whatever unit you use).
Reliability and Survival of the Fittest
Reliability analyses in Minitab also include many other useful tools, including hazard plots, cumulative failure plots, distribution ID overviews, estimation test plans, demonstration test plans, warranty analyses, and more. If you haven't had a chance to explore this area of statistical analysis, I'd encourage you to check it out.
Even when the failure of a product doesn't have life and death implications, the stakes for its reliability are high. In its Engineering Statistics handbook, the National Institute of Standards and Technology (NIST) puts it this way:
Or, as Warren Buffett has famously said, "It takes 20 years to build a reputation and only 5 minutes to ruin it. If you think about it, you’ll do things differently.”
In the field of quality improvement, the vital importance of product reliability is a message that we hope everyone hears loud and clear.
Case study:
Time-to-Market and Design for Reliability at the Speed of Light in Signify
Get ready for a light bulb moment! In a fast-changing industry where time-to-market and product reliability give a competitive edge, discover how the world’s leading lighting company Signify, rapidly validates new innovations. In this one hour webinar, Prof W.D. van Driel and Dr P. Watté will shed a light on design for reliability (DfR) using Minitab Statistical Software at Signify, the former Philips Lighting. Learn from real-life examples their methods to lower your development costs, improve your designs’ performance and compliance, and accelerate the testing of product design reliability. If you develop products intended to meet high specifications for years to come, you will discover how to reduce the risks and consequences of product failure and costly claims - for you and your customers.

![[Webinar Replay] Time-to-Market and Design for Reliability at the Speed of Light at Signify](https://no-cache.hubspot.com/cta/default/3447555/b70a5a3e-03b6-408b-bbc1-7851ef13e4e9.png)