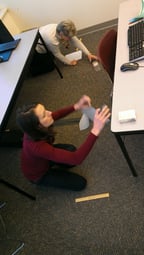
So this time, we finally have the fun of getting to look at the full gage R&R results. Here’s how the data turned out, and some of the exciting stuff that went along with getting it.
| RunOrder | Operators | Parts | Measurements |
|---|---|---|---|
| 1 | J1 | Red | 37.9375 |
| 2 | J1 | Green | 28.375 |
| 3 | J1 | Yellow | 72.25 |
| 4 | J2 | Yellow | 72.0625 |
| 5 | J2 | Red | 38.25 |
| 6 | J2 | Green | 28.4375 |
| 7 | Kevin | Red | 41.0625 |
| 8 | Kevin | Green | 22.25 |
| 9 | Kevin | Yellow | 72.1875 |
| 10 | J3 | Green | 22.1875 |
| 11 | J3 | Yellow | 72.3125 |
| 12 | J3 | Red | 40.9375 |
| 13 | M | Red | 40.8125 |
| 14 | M | Yellow | 72 |
| 15 | M | Green | 22.3125 |
| 16 | J1 | Yellow | 72 |
| 17 | J1 | Red | 38.125 |
| 18 | J1 | Green | 28.4375 |
| 19 | J2 | Yellow | 72 |
| 20 | J2 | Red | 38.125 |
| 21 | J2 | Green | 28.375 |
| 22 | Kevin | Red | 40.9375 |
| 23 | Kevin | Green | 22.25 |
| 24 | Kevin | Yellow | 72 |
| 25 | J3 | Green | 22.3125 |
| 26 | J3 | Yellow | 72.25 |
| 27 | J3 | Red | 40.9375 |
| 28 | M | Yellow | 72.25 |
| 29 | M | Green | 22.3125 |
| 30 | M | Red | 41 |



One of the nice things about Minitab Statistical Software is that the Assistant Menu provides easy-to-understand summaries of many analyses. One of these covers the Gage R&R Study.
- Choose Assistant > Measurement Systems Analysis (MSA).
- In the flow chart, click the image for Gage R&R Study (Crossed).

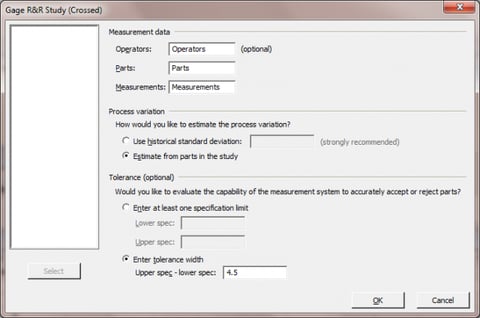
- In Operators, enter the column that identifies who took each measurement.
- In Parts, enter the column that contains the part that was measured.
- In Measurements, enter the column that contains the measuerments of your volunteers.
- In the second section, click Estimate from parts in the study.
- In the third section, click Enter tolerance width.
- In Upper spec – lower spec, enter 4.5, which we used when we did our Type I Gage Study because it’s the diameter of a CD. Click OK.
This first control chart won't match what you'll get if you use the data aboves, because I had a data entry error. If you see a problem, especially in a simple measurement like this, remember to check your own work first. It’s important to investigate the simplest explanation or you risk a wild goose chase. The red dot in the R chart was my fault!

The corrected data is not free of problems to investigate. The summary report says that the measurement system variation is 336% of the tolerance, which seems to indicate a real problem. What happened?
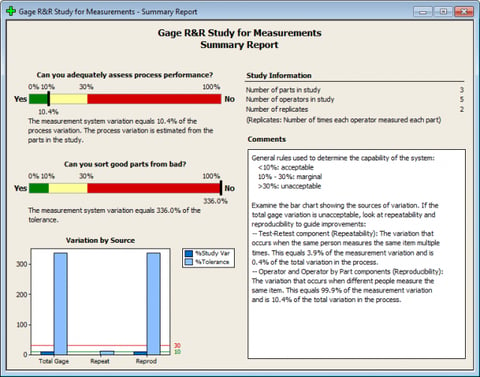
The Variation by Source chart shows that the problem is with reproducibility, which means that our different operators came up with very different lengths for the different colors of gummi bears. We’ll examine the Variation Report to try to identify the problem.
The lengths I measured are so large compared to the variation, that the problem doesn’t leap out, but the Xbar Chart of Part Averages by operator and the Reproducilibity-Operator by Part Interaction plots tell the story.
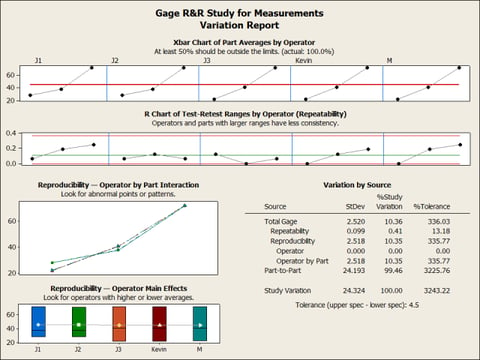
Interestingly, the hardest part to measure, the yellow gummi bear that was 72 inches from 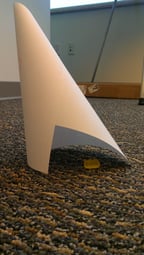 the start point, is the most consistent between all 5 people. But J1 and J2 measured the green gummi bear to be about 28 inches from the wall, while J3, Kevin and M measured it to be closer to 22 inches from the wall. Likewise, J1 and J2 measured the green gummi bear to be about 28 inches from the wall, while J3, Kevin, and M measured it to be about 41 inches from the wall.
To me, it’s not hard to know what happened, because I know that these were the two groups that measured the closest together in time. While it’s possible there’s a problem with the measurement system, the most likely explanation is that my “experiment in progress” cones were not totally effective in keeping my gummi bears in the same place. I’d be inclined to blame someone other than myself, but it’s most likely my fault again. On the plus side, it gives you a great picture of what a reproducibility problem looks like in your Minitab output!
Have a few more minutes? I bet you found the Assistant Menu tantalizing. Check out this video to see more of what it can do!


