Last time, I suggested that candy was a good way to start building your confidence with statistics. We collected some simple data to make a bar chart, to start easy. Remember that to do quality analysis, it’s important to collect useful data, and that skill takes practice. This week, with the help of gummi bears, we’ll try out a cause-and-effect diagram. The cause-and-effect diagram is a tool you can use to help plan your data collection so that you can find out what you really want to know. The most popular form of the diagram is fondly known as the fishbone diagram.
For collecting data, gummi bears have nice properties. Compared to hard, circular candy, they don’t bounce or roll very much. I’m grateful to Cobb and Miao for coming up with Bears in Space, which is still one of the most fun ways to use candy to learn statistics.
We won’t discuss how to conduct the statistics experiment that Cobb and Miao describe yet, but we will discuss the materials and the goals. To do the experiment, you need:
- 10 gummi bears (more if you want to eat any)
- A tape measure or other convenient device for measuring distance
- A yard stick or other convenient launch ramp
- Two popsicle sticks
- 1 pencil
- 1 rubber band (unless you break it, then you’ll need more)
- 4 thick books
The goal of the experiment is to determine how the launch angle of a catapult built from the materials affects the distance that a gummi bear travels.
Before you collect the data, it’s important to think about what factors, besides the angle, will affect distance. This question of other factors is an old one in design of experiments, and this is where the fishbone diagram comes in.
This isn’t the first time that anyone’s ever done a fishbone diagram, so it’s worth looking at some of the stock setups that people use to help guide their thoughts. The “Man Machines Materials Fishbone” that Eston Martz describes is a good starting point.
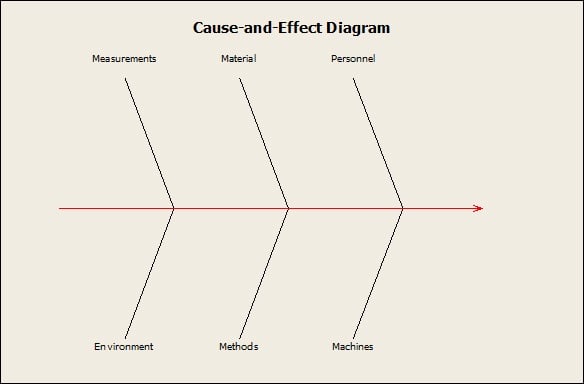
To create an initial diagram in Minitab, choose Stat > Quality Tools > Cause-and-Effect and click OK.

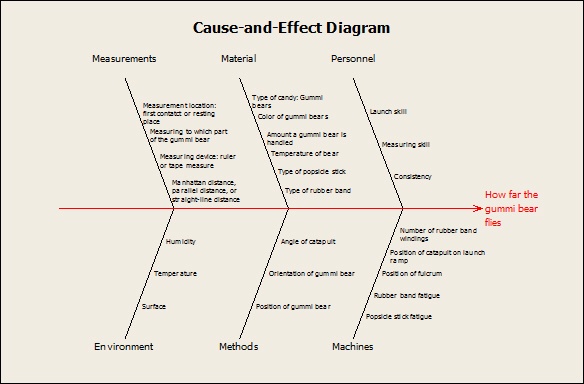
From here, start thinking of factors that might affect how far the gummi bear flies. Write them down on the fishbone diagram. When you’re done, your diagram will look something like this:

Does it particularly matter whether “Position of fulcrum” appears in Machines or Methods? Not really. Nor should you get too caught up in whether “Position of gummi bear” and “Position of fulcrum” are in the same or different categories. The important part is that you decide whether you’re going to intentionally vary these factors or intentionally keep them the same. That’s the kind of thinking that you want to practice so that you can do quality improvement analysis.
If you have more than a few minutes, check out Carly Barry’s ideas for how to use a fishbone diagram to promote marital bliss.


