


Minitab’s Assistant got a lot of splashy upgrades for Minitab 17. The addition of DOE and multiple regression to the Assistant are large feature improvements with obvious advantages. But there are many subtler, but still fantastic additions that shouldn't be overlooked.
One of those additions is the example patterns added to the Stability Report for control charts.
The Stability Report was excellent in Minitab 16, clearly showing you the out-of-control points in the process:
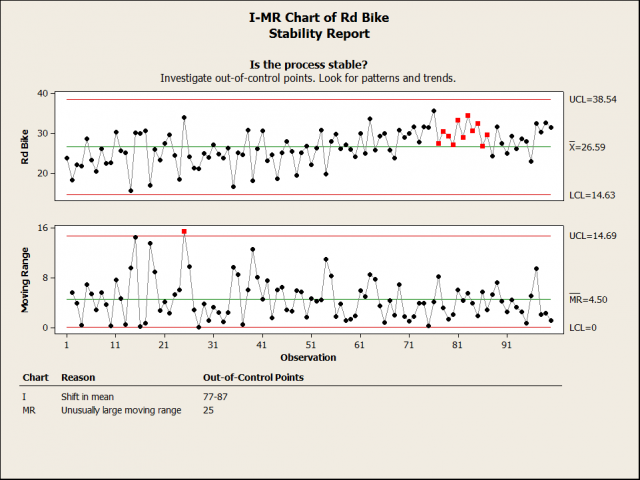
But the truth is that it’s sometimes hard to move from detecting the out-of-control points to an understanding of what’s going on in the process. That’s where the example patterns in the Assistant come into play.
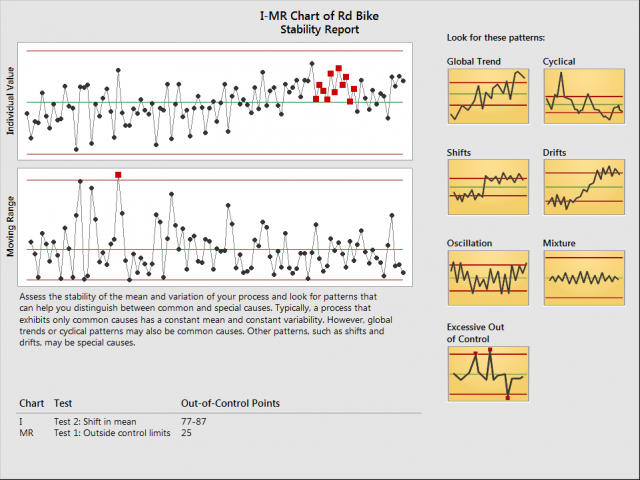
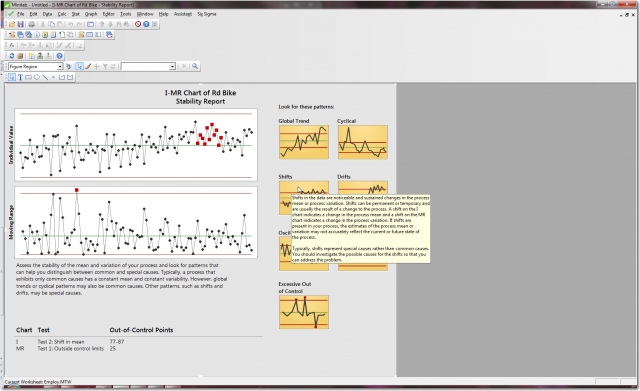
In the Minitab 17 report shown above, you still see the out-of-control points, but the Stability Report also reminds you what kinds of patterns are usually meaningful in a control chart. Even better, if you see one of the patterns in your data, then you can get more information about the pattern from the tooltip on the example chart. For the shift in the process mean that you see above, the tooltip reminds you:
Shifts in the data are noticeable and sustained changes in the process mean or process variation. Shifts can be permanent or temporary and are usually the result of a change to the process. A shift on the I chart indicates a change in the process mean and a shift on the MR chart indicates a change in the process variation. If shifts are present in your process, the estimates of the process mean or variation may not accurately reflect the current or future state of the process.
Typically, shifts are due to special causes rather than common causes. You should investigate the possible causes for the shifts so that you can address the problem.
The patterns to look for and the information that Minitab supplies for understanding the patterns are just one more way that the Assistant walks you through every step of your analysis so that you can be confident in the results.
Want to try it out for yourself? The data that I used to illustrate the tooltip is from one of our new Quick Start Exercises that you can use to get on the path of becoming a fearless data analyst. You’ll want to try them all!