


Since we added them to Minitab Statistical Software, we've gotten great feedback from many people who have been using the General Linear Model and Regression tools.
But in speaking with people as part of Minitab's Technical Support team, I've found many are noticing that there are two coding schemes available with each. We frequently get calls from people asking how the coding scheme you choose affects your results. I will show you here.
General Linear Model vs. Regression
First, let’s review Minitab’s General Linear Model (GLM) and Regression tools.
GLM uses a (-1,0,1) coding scheme by default. Regression uses (1,0) by default. If you make them match in the Coding sub-dialog box, you will get the same results.
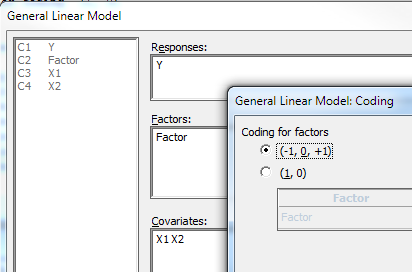
Suppose you have a continuous dependent variable (Y), one categorical variable (Factor, with 3 levels, 1, 2, and 3) and 2 continuous variables (X1 and X2), and you use the same coding scheme (-1,0,1) to analyze your data using both GLM and Regression.
Here's the dialog box you'll see when you select Stat > ANOVA > General Linear Model > Fit General Linear Model... and select the "Coding" options button.
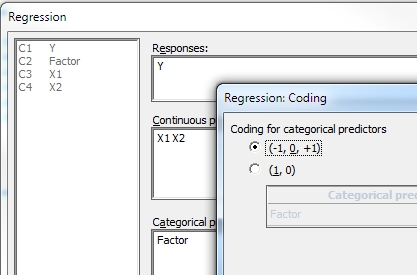
And here's the dialog box you'll see when you select Stat > Regression > Regression > Fit Regression Model... and select the "Coding" options button.
And here are the results of the analyses:
Notice that aside from Regression having an additional line in its ANOVA table, and having a different subtitle ("Factor coding" instead of "Categorical predictor coding"), you get the same results.
(-1,0,1) Coding Scheme vs. (1,0) Coding Scheme
So what if you don’t make the coding schemes match and keep the default coding scheme for each?
Here is the output using GLM with the (1,0) coding scheme. (Note that the results would be the same if we ran Regression with the (1,0) scheme.)
How do the results from (1,0) scheme differ from the results from the (-1,0,1) scheme above?
Compare them and you'll see that coefficients and the equations are different. So what if you want to use the equations to calculate predicted values (i.e., “plug into the equation”)? How do you work with these two different equations?
(-1,0,1) Coding Scheme
Let’s return to the (-1,0,1) coding scheme. Here is the equation:
Y = 205.44 + 1.158 X1 + 0.2416 X2 - 4.54 Factor_a + 1.46 Factor_b + 3.08 Factor_c
Use the actual values for the continuous factors, X1 and X2.
- To predict for Factor=a, plug in Factor_a=1, Factor_b=0, Factor _c=0
- To predict for Factor=b, plug in Factor_a=0, Factor_b=1, Factor _c=0
- To predict for Factor=c, plug in Factor_a=0, Factor_b=0, Factor _c=1
Let’s try it! Let’s predict for X1=3.5, X2=6.0, Factor=a

Now let’s predict for X1=6.5, X2=-9.9, Factor=c

At this point, you may be wondering why this coding scheme is called (-1,0,1) if you plug in 1 or 0?
With this coding scheme there only needs to be k-1 coefficients to provide coefficients for all k groups.
You sometimes even see the equation for (-1,0,1) coding scheme written without the last level. The equation above could be written as:
Y = 205.44 + 1.158 X1 + 0.2416 X2 - 4.54 Factor_a + 1.46 Factor_b
In this case:
- To predict for Factor=a, plug in Factor_a=1, Factor_b=0
- To predict for Factor=b, plug in Factor_a=0, Factor_b=1
- To predict for Factor=c, plug in Factor_a=-1, Factor_b=-1
You get the same result when predicting for X1=6.5, X2=-9.9, Factor=c:

Note that (-4.54)*(-1)+1.46*(-1) = 3.08, which is the coefficient above for c.
(1,0) Coding Scheme
Now let’s switch to the (1,0) coding scheme. Here is the equation:
Y = 200.90 + 1.158 X1 + 0.2416 X2 + 0.0 Factor_a + 6.00 Factor_b + 7.62 Factor_c
Use the actual values for the continuous factors, X1 and X2.
- To predict for Factor=a, plug in Factor_a=1, Factor_b=0, Factor _c=0
- To predict for Factor=b, plug in Factor_a=0, Factor_b=1, Factor _c=0
- To predict for Factor=c, plug in Factor_a=0, Factor_b=0, Factor _c=1
Let’s predict for the same observations we did above.
X1=3.5, X2=6.0, Factor=a

X1=6.5, X2=-9.9, Factor=c

Notice both of these predictions (i.e., fitted values) are the same as those for the (-1,0,1) coding scheme.
Single vs. Separate Equations
In Minitab, you can display a single equation which contains the last level, or (using the Results sub-dialog box) separate equations. When you display separate equations, the coefficients in the table will differ for the two coding schemes (as we saw above), but the equations, as well as the rest of the output, will match for the two coding schemes.
Factor
a Y = 200.90 + 1.158 X1 + 0.2416 X2
b Y = 206.90 + 1.158 X1 + 0.2416 X2
c Y = 208.53 + 1.158 X1 + 0.2416 X2
In my next post, I’ll focus on showing what the different coefficients represent.