In my last post, I revealed how the Assistant in Minitab Statistical Software could guide me to the right statistical hypothesis test, even though I'd forgotten everything I once knew about statistics. But knowing the right test to use is only half the challenge.
Now I need to actually do the hypothesis test.Guidelines and How-To's for the 2-Sample t-test
Thanks to the Assistant, I know I need to use the 2-sample t-test. So how can I make sure I do the test right?
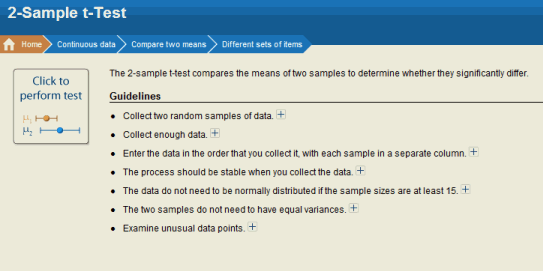
Good thing the Assistant is still here. Once I identify the test I need, the Assistant offers some helpful guidelines I can use to make sure I'm on track:

Clicking on any of the + symbols above yields a detailed explanation that tells me exactly what I need to do or watch out for. Sweet!
I'm even starting to recall some of the things I learned in my first statistics class, lo those many moons ago!
Performing the 2-sample t-test with the Assistant
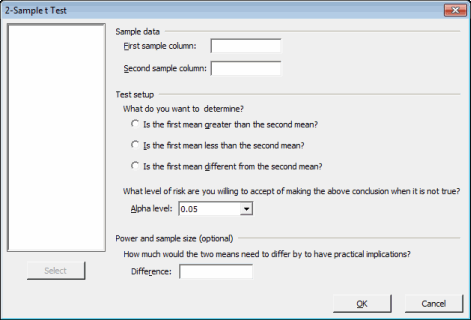
So, having reviewed the guidelines, I'll go ahead and press on the "Click to perform test" button shown above. Up pops this dialog box:

The first thing to notice is how friendly this dialog box is. For example, the "Test setup" section makes it very easy to select appropriate variation of a 2-sample t-test for your situation, by selecting which of these three questions you want to answer:
- Is the first mean greater than the second mean?
- Is the first mean less than the second mean?
- Is the first mean different from the second mean?
All you need to do is tell the Assistant which columns to use for the first and second sample, select your test option, and press OK. It's very easy to do the test using Minitab's Stat menu, too, but if you're feeling a little rusty on the statistics lingo, the language in the Assistant is more straightforward.
Understanding the Results of the 2-sample t-Test
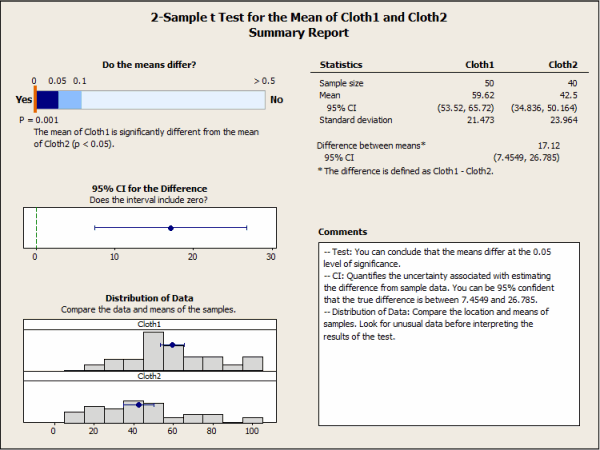
The emphasis on clear, easy-to-understand language carries through to the results the Assistant provides after performing your hypothesis test. Continuing the scenario I used in the previous post, I wanted to see if cloth from one supplier performed differently than cloth from another provider, and collected data on when samples from each would rip. If you want to follow along, feel free to use my data. The Assistant gives me the following summary of the test results:

The question "Do the means differ?" is immediately answered. The Assistant tells me that yes, the means are significantly different from one another, and even provides a bar graph that helps me interpret the confidence with which I can make that conclusion.
It also shows me the distribution of the data for both samples, and provides a table of summary statistics. Finally, the "Comments" section lays out the conclusions and also potential concerns in plain language:
-- Test: You can conclude that the means differ at the 0.05 level of significance.
Good deal!
Best of all, I could give this report directly to my (completely hypothetical) boss, who never had a statistics course in her life, and be sure it's clear enough to follow. And that's something I'd appreciate even if I did always remember what hypothesis test to use!
I think I need to write a thank-you note to the Assistant!
Where do you turn for guidance with your statistical questions?


