P-values are frequently misinterpreted, which causes many problems. I won't rehash those problems here since we have the rebutted the concerns over p-values in Part 1. But the fact remains that the p-value will continue to be one of the most frequently used tools for deciding if a result is statistically significant.
You know the old saw about "Lies, damned lies, and statistics," right? It rings true because statistics really is as much about interpretation and presentation as it is mathematics. That means we human beings who are analyzing data, with all our foibles and failings, have the opportunity to shade and shadow the way results get re ported.While I generally like to believe that people want to be honest and objective—especially smart people who do research and analyze data that may affect other people's lives—here are 500 pieces of evidence that fly in the face of that belief.
We'll get back to that in a minute. But first, a quick review...
What's a P-Value, and How Do I Interpret It?
Most of us first encounter p-values when we conduct simple hypothesis tests, although they also are integral to many more sophisticated methods. Let's use Minitab Statistical Software to do a quick review of how they work (if you want to follow along and don't have Minitab, the full package is available free for 30 days). We're going to compare fuel consumption for two different kinds of furnaces to see if there's a difference between their means.
Go to File > Open Worksheet, and click the "Look in Minitab Sample Data Folder" button. Open the sample data set named Furnace.mtw, and choose Stat > Basic Statistics > 2 Sample t... from the menu. In the dialog box, enter "BTU.In" for Samples, and enter "Damper" for Sample IDs.
Press OK and Minitab returns the following output, in which I've highlighted the p-value.
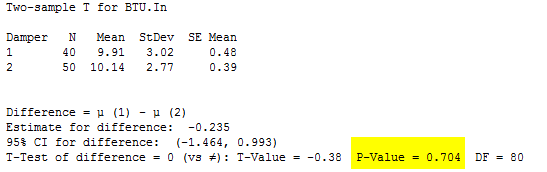
In the majority of analyses, an alpha of 0.05 is used as the cutoff for significance. If the p-value is less than 0.05, we reject the null hypothesis that there's no difference between the means and conclude that a significant difference does exist. If the p-value is larger than 0.05, we cannot conclude that a significant difference exists.
That's pretty straightforward, right? Below 0.05, significant. Over 0.05, not significant.
Ready for a demo of Minitab Statistical Software? Just ask!

"Missed It By That Much!"
In the example above, the result is clear: a p-value of 0.7 is so much higher than 0.05 that you can't apply any wishful thinking to the results. But what if your p-value is really, really close to 0.05?
Like, what if you had a p-value of 0.06?
That's not significant.
Oh. Okay, what about 0.055?
Not significant.
How about 0.051?
It's still not statistically significant, and data analysts should not try to pretend otherwise. A p-value is not a negotiation: if p > 0.05, the results are not significant. Period.
So, what should I say when I get a p-value that's higher than 0.05?
How about saying this? "The results were not statistically significant." If that's what the data tell you, there is nothing wrong with saying so.
No Matter How Thin You Slice It, It's Still Baloney.
Which brings me back to the blog post I referenced at the beginning. Do give it a read, but the bottom line is that the author cataloged 500 different ways that contributors to scientific journals have used language to obscure their results (or lack thereof).
As a student of language, I confess I find the list fascinating...but also upsetting. It's not right: These contributors are educated people who certainly understand A) what a p-value higher than 0.05 signifies, and B) that manipulating words to soften that result is deliberately deceptive. Or, to put it in words that are less soft, it's a damned lie.
Nonetheless, it happens frequently.
Here are just a few of my favorites of the 500 different ways people have reported results that were not significant, accompanied by the p-values to which these creative interpretations applied:
- a certain trend toward significance (p=0.08)
- approached the borderline of significance (p=0.07)
- at the margin of statistical significance (p<0.07)
- close to being statistically significant (p=0.055)
- fell just short of statistical significance (p=0.12)
- just very slightly missed the significance level (p=0.086)
- near-marginal significance (p=0.18)
- only slightly non-significant (p=0.0738)
- provisionally significant (p=0.073)
and my very favorite:
- quasi-significant (p=0.09)
I'm not sure what "quasi-significant" is even supposed to mean, but it sounds quasi-important, as long as you don't think about it too hard. But there's still no getting around the fact that a p-value of 0.09 is not a statistically significant result.
The blogger does not address the question of whether the opposite situation occurs. Do contributors ever write that a p-value of, say, 0.049999 is:
- quasi-insignificant
- only slightly significant
- provisionally insignificant
- just on the verge of being non-significant
- at the margin of statistical non-significance
I'll go out on a limb and posit that describing a p-value just under 0.05 in ways that diminish its statistical significance just doesn't happen. However, downplaying statistical non-significance would appear to be almost endemic.
That's why I find the above-referenced post so disheartening. It's distressing that you can so easily gather so many examples of bad behavior by data analysts who almost certainly know better.
You would never use language to try to obscure the outcome of your analysis, would you?