


Suppose that you plan to source a substantial amount of parts or subcomponents from a new supplier. To ensure that their quality level is acceptable to you, you might want to assess the capability levels (Ppk and Cpk indices) of their manufacturing processes and check whether their critical process parameters are fully under control (using control charts). If you are not sure about the efficiency of the supplier quality system or if you cannot get reliable estimates of their capability indices, you will probably need to actually inspect the incoming parts from this vendor.
However, checking all parts is expensive and time consuming. In addition to that, visually inspecting 100% of all parts will not necessarily ensure that all defective parts are detected (operators will eventually get tired performing repetitive visual inspections).Acceptance sampling is a more efficient approach: to reduce costs, a smaller sample of parts is selected (in a random way to avoid any systematic bias) from a larger batch of incoming products, these sampled parts are then inspected.
Attribute Acceptance Sampling
The Acceptable Quality Level (AQL) of your supplier is the quality level that you expect from them (a proportion of defectives that is still considered acceptable). If the proportion of defectives is larger than that, the whole batch should get rejected (with a financial penalty for the supplier). The RQL is the Rejectable Quality Level (a proportion of defectives that is not considered acceptable, in which case the whole batch should be rejected).
The graph below represents the probability to accept a batch for a given proportion of defectives. The probability to accept the whole batch when the actual percentage of defectives in the batch is 1% (1% is the AQL in this case) is 98.5%, but if the true percentage of defectives increases to 10% (10% is the RQL), the probability to accept the whole batch will be 9.7%.
The inspection criterion, in this case, should be the following: check 52 parts, and if there are more than 2 defective parts, then reject the whole batch. If there are two defective parts or less, then do not reject. The AQL and the RQL need to be negotiated with your supplier, whereas the acceptance criteria are calculated by Minitab.
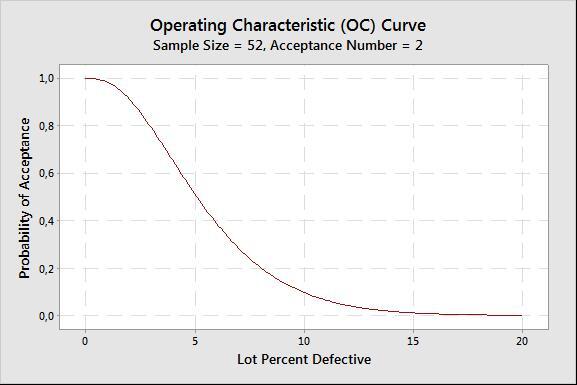
This graph represents the probability to accept a batch for a given proportion of defectives.
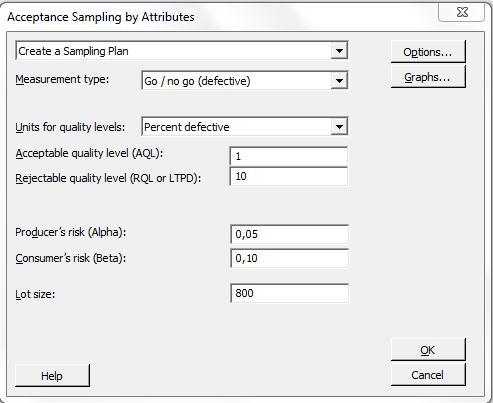
In Minitab, go to Stat > Quality Tools > Acceptance Sampling by Attributes... and enter your AQL and RQL as displayed in the dialogue box below to obtain the acceptance criteria.
C = 0 Inspection Plans (Acceptance Number of 0):
From a quality assurance point of view, however, in many industries the only acceptable publicized quality level is 0% defective parts. Obviously, the ideal AQL should be 0. You may have a difficult time explaining your final customers that a small proportion of defectives is still acceptable. So let's focus on 0 defective control plans, when the acceptance number is 0 and a batch is rejected as soon as a single defective is identified in the sample.
Note that Minitab will not allow you to enter an AQL of exactly 0 (it should always be larger than 0).
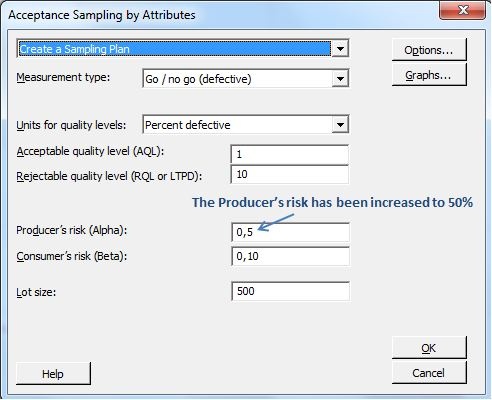
The Producer’s Risk
If the acceptance number is set to 0, the conditions for accepting a lot become considerably more restrictive. One consequence of setting very strict standards for accepting a batch is that if quality is not 100% perfect, and even with a very small proportion of defectives, the probability of rejecting a batch will increase very rapidly.
The Alpha risk (the Producer’s risk) is the probability to reject a batch even though the proportion of defectives is very small. This impacts the producer since many of the batches they deliver will get rejected if the true proportion of defectives is not exactly 0.
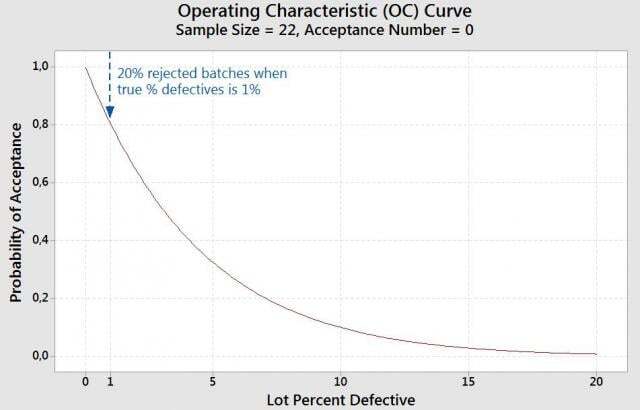
In the graph below the probability to accept a batch with a 1% defective rate is now 80% (so that nearly 20% of the batches will get rejected if the true proportion of defectives is 1%)! This high rejection rate is the price we need to pay for the very strict 0 acceptance number.
Conclusion
The sample size to inspect is smaller with an acceptance number of 0 (22 parts are inspected in the second graph vs. 52 in the first graph). However, this is a very ambitious objective. If the true percentage of defectives is, say, 0.5% in the batches (if the AQL is set at 0.5%), then 10,4% of all batches will get rejected.
To obtain a lower and more realistic proportion of rejected batches, the level of quality from your supplier should be nearly 100% perfect (almost 100% good parts).