


All processes are affected by various sources of variations over time. Products which are designed based on optimal settings, will, in reality, tend to drift away from their ideal settings during the manufacturing process.
Environmental fluctuations and process variability often cause major quality problems. Focusing only on costs and performances is not enough. Sensitivity to deterioration and process imperfections is an important issue. It is often not possible to completely eliminate variations due to uncontrollable factors (such as temperature changes, contamination, humidity, dust etc…).
For example, the products sold by your company might go on to be used in many different environments across the world, or in many different (and unexpected) ways, and your process (even when it has been very carefully designed and fine-tuned) will tend to vary over time.
"Variability is the enemy."
The most efficient and cost effective solution to that issue is to minimize the impact of these variations on your product's performance.
Even though variations in the inputs will continue to occur, the amount of variability that will still be “transmitted” to the final output may be reduced. But the major sources of variations need to be identified in order to study the way in which this variability “propagates” into the system. The ultimate objective is to reduce the amount of variability (from the inputs) that affects your final system.
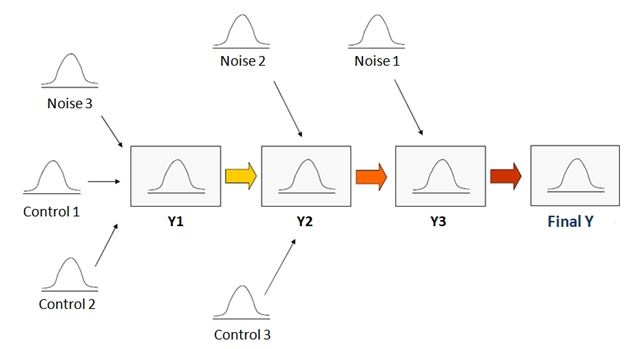
It is possible to better assess the noise (uncontrollable variations from the inputs) factor effects using an ANOVA, a Design of Experiments (DOE), or a regression analysis. Some parameters that are easily controllable (control factors) in your system may interact with these noise effects. Interacting, in this instance, means that a noise factor effect may be modified by a controllable factor. If that is the case, we can use this noise*control interaction to minimize the noise effects.
Two Approaches to Understanding and Reducing Variability
There are actually two ways in which we can reduce the amount of variability that affects your process:
- Use non-linear effects: Response surface DOEs may be used to study curvatures and quadratic effects. In the graph below, you can see that factor B has a quadratic effect on the Y response.
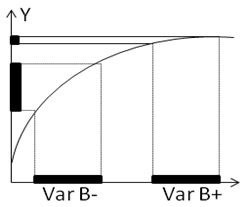
The slope of the curve is much steeper for low values of B (B-), with a shallow slope for larger values of B (B+). The shallow part of the curve is the so-called “sweet spot.” Although the variations of B at the – or at the + level are strictly equivalent, the amount of variability that is propagated to Y is much smaller at B+ (the sweet spot). Setting B at its + level can make the process more robust to variations in the B variable. - Use Interaction effects: The next graph shows the interaction of a noise factor (B) with an easily controllable factor (C).
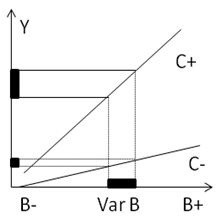
The slopes of the two lines represent the linear effect of the noise factor (B), and the difference between the two lines represents the controllable factor effect (C). Please note that the B (Noise) effect is much smaller when C (the controllable factor) is set at its – level (C-). Therefore one can use the C factor to minimize the B (noise) effect, thereby making the process more robust to the fluctuations of B.
A Manufacturing Example
The objective in this example is to improve the robustness of an automotive part (a recliner) to load changes.
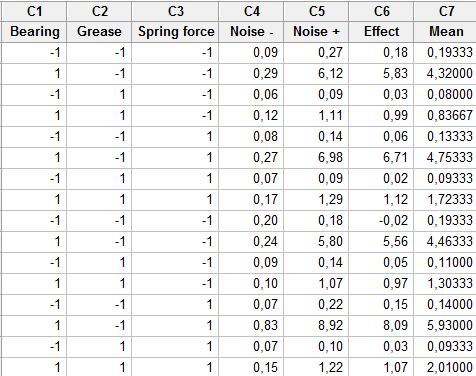
The noise factor is the load. Two levels have been tested: no load (Noise -) or large load (Noise +)). There also are three easily controllable factors: Type of grease, Type of Bearing, and Spring Force), each with two levels. The design is a full 23 DOE which has been replicated twice (8*2=16 runs for every combination of the noise factor level).
The response is the acceleration signal. The runs have been performed with no load (Noise at level -) and with a large load (Noise at level +). The Noise effect is the difference between those two runs (Noise Effect = (“Noise +”) – (“Noise –“)) .
The mean effect of the noise factor is 1.9275, and the goal is to minimize this noise effect. It's also important to minimize the amount of acceleration.
The analysis of the experimental design has been performed using Minitab Statistical Software. Two responses have been studied : Acceleration Signal, and Noise (Load) effect, both of which are important to optimizing the system.
The Design of experiments array is pictured below. For each line of the Minitab worksheet, a noise effect has been calculated (Effect = (“Noise +”) – (“Noise –“)). An acceleration signal Mean has also been computed.
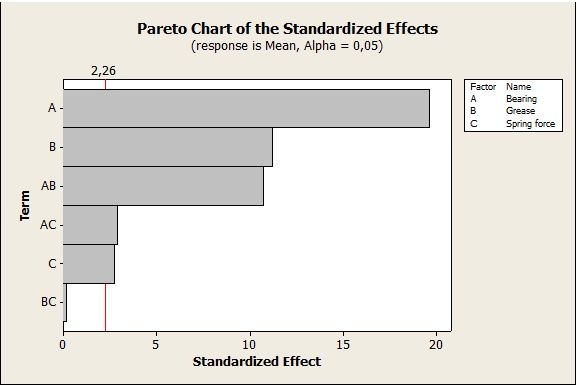
The following Pareto chart shows the factor effects on the acceleration signal mean. Bearing, Grease and Spring Force are all significant, two interactions (AB and AC) are also significant (above the red significance threshold).
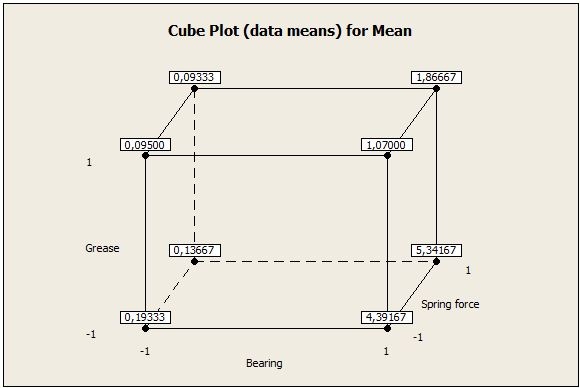
The Cube plot shows that a Type -1 bearing combined with a Type 1 grease lead to a low acceleration signal:
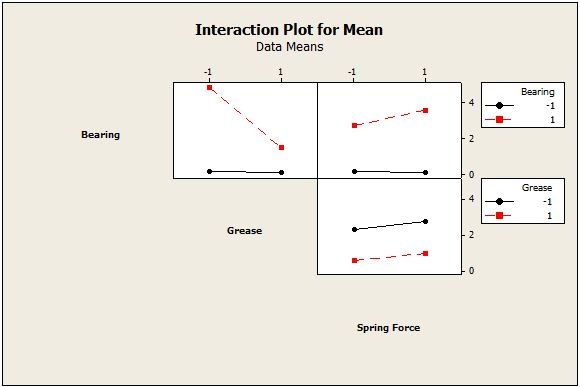
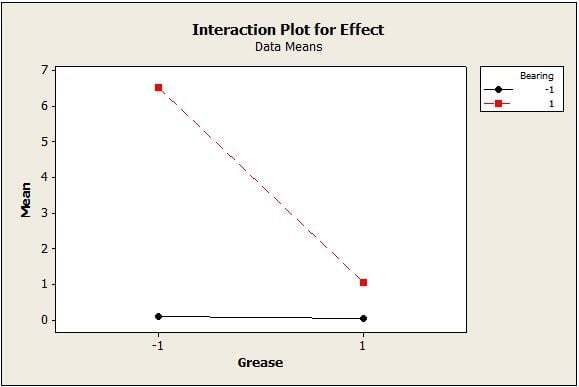
The interaction plot illustrates the effect of the Bearing * Grease interaction on the final output Mean response. When Bearing is set at its –1 level, Grease has almost no effect on the acceleration signal.
Impact of Controllable Factors on Noise Effects
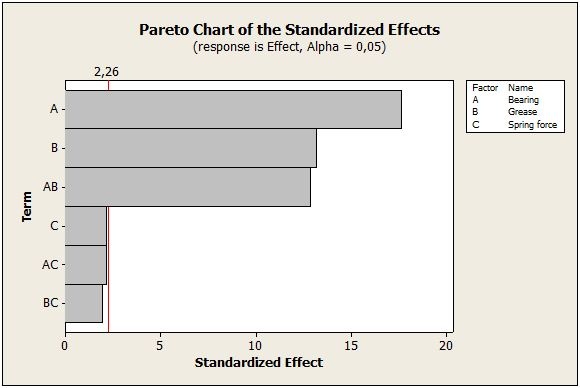
The next Pareto chart is used to study the controllable factor effects on the Noise effects, when noise effect represents the final output response. A, B and the AB interaction are all significant (above the red significance threshold).
The interaction plot illustrates the Bearing*Grease interaction effect on the noise effect response : a Type -1 Bearing leads to much smaller noise effects, and when Bearing is set at its –1 level, Grease has almost no impact on the Noise effect.
Conclusion
This DOE analysis shows that selecting a Type -1 Bearing can substantially reduce the acceleration signal and the noise effect. Therefore the system is now much more robust to loading changes. This was the final objective. I decided to study the effect of the controllable factors on the noise effects directly rather than use more complex responses (such as Taguchi’s Signal To Noise ratio), as I thought it would be easier to understand and more explicit.
I hope this example illustrates how Design of Experiments can be a powerful tool to make processes and products less sensitive to variations in their environment.