


To assess if a process is stable and in statistical control, you can use a control chart. It lets you answer the question "is the process that you see today going to be similar to the process that you see tomorrow?" To assess and quantify how well your process falls within specification limits, you can use capability analysis.
Both of these tools are easy to use in Minitab, but you first need to properly setup your data. Here’s how.
Chronological Order
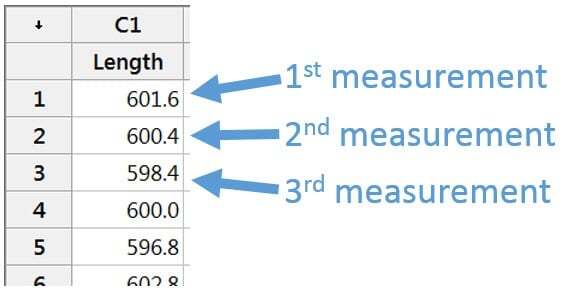
Your data should be entered in the order in which it was collected. The first measurement you take should be recorded in row 1. Then the next measurement belongs in row 2, etc. Data should never be sorted (e.g., arranged from smallest to largest) when creating control charts or running capability analysis.
Data Collected in Subgroups
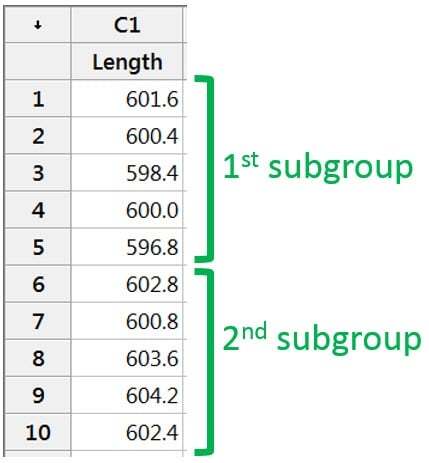
If you collect your data in subgroups – say you collect 5 parts every hour – then those 5 individual data points don’t necessarily need to be in chronological order. However, in your Minitab worksheet, the first set of 5 data points collected needs to fall before the next set of 5 data points collected, and so on. You can then enter ‘5’ for your subgroup size in the Stat > Control Charts, Stat > Quality Tools > Capability Analysis, and Assistant dialog boxes.
Missing Data
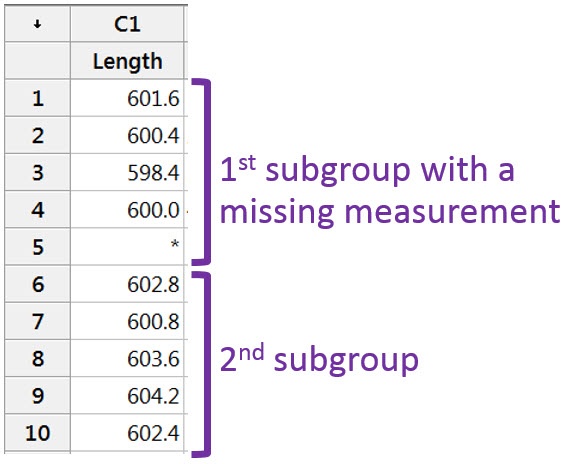
Suppose you intend to collect 5 data points every hour, but during one of the hours you collect only 4 data points. In the case that your sample size falls short, you can represent the missing data point(s) with an asterisk (*).
Subgroup Indicator
Suppose you intend to collect 5 data points every hour, but during one of the hours you collect 6 data points. Rather than tossing out perfectly good data, you can create a subgroup indicator column to let Minitab know that the subgroup size varies. You can then enter this subgroup column in the Stat > Control Charts and Stat > Quality Tools > Capability Analysis dialog boxes.
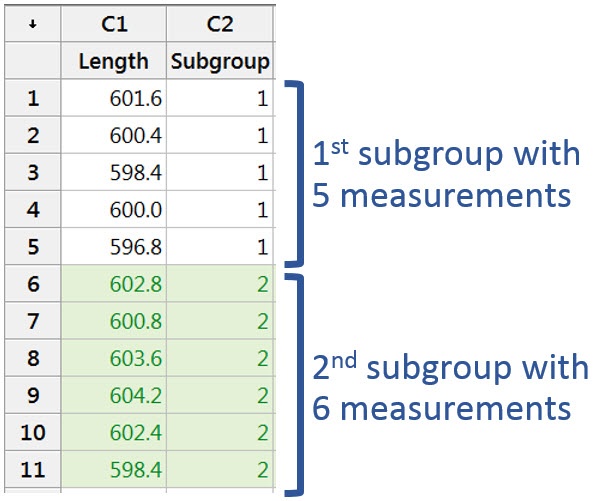
Note that you can use a subgroup indicator column for any of the cases above. It’s only absolutely required when your subgroup size varies.
When creating control charts or running capability analysis, the order in which your data appears directly impacts the resulting charts and calculations. Therefore, it’s important to make sure you enter your data properly.