Once upon a time, when people wanted to compare the standard deviations of two samples, they had two handy tests available, the F-test and Levene's test.
Statistical lore has it that the F-test is so named because it so frequently fails you.1 Although the F-test is suitable for data that are normally distributed, its sensitivity to departures from normality limits when and where it can be used.
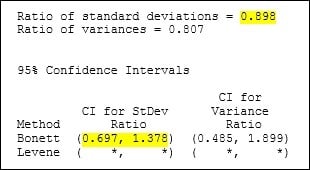
Levene’s test was developed as an antidote to the F-test's extreme sensitivity to nonnormality. However, Levene's test is sometimes accompanied by a troubling side effect: paradoxical dissociations. To see what I mean, take a look at these results from an actual test of 2 standard deviations that I actually ran using actual data that I actually made up:

Nothing surprising so far. The ratio of the standard deviations from samples 1 and 2 (s1/s2) is 1.414 / 1.575 = 0.898. This ratio is our best "point estimate" for the ratio of the standard deviations from populations 1 and 2 (Ps1/Ps2).
Note that the ratio is less than 1, which suggests that Ps2 is greater than Ps1.
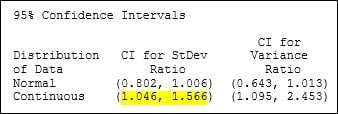
Now, let's have a look at the confidence interval (CI) for the population ratio. The CI gives us a range of likely values for the ratio of Ps1/Ps2. The CI below labeled "Continuous" is the one calculated using Levene's method:

What in Gauss' name is going on here?!? The range of likely values for Ps1/Ps2—1.046 to 1.566—doesn't include the point estimate of 0.898?!? In fact, the CI suggests that Ps1/Ps2 is greater than 1. Which suggests that Ps1 is actually greater than Ps2.
But the point estimate suggests the exact opposite! Which suggests that something odd is going on here. Or that I might be losing my mind (which wouldn't be that odd). Or both.
As it turns out, the very elements that make Levene's test robust to departures from normality also leave the test susceptible to paradoxical dissociations like this one. You see, Levene's test isn't actually based on the standard deviation. Instead, the test is based on a statistic called the mean absolute deviation from the median, or MADM. The MADM is much less affected by nonnormality and outliers than is the standard deviation. And even though the MADM and the standard deviation of a sample can be very different, the ratio of MADM1/MADM2 is nevertheless a good approximation for the ratio of Ps1/Ps2.
However, in extreme cases, outliers can affect the sample standard deviations so much that s1/s2 can fall completely outside of Levene's CI. And that's when you're left with an awkward and confusing case of paradoxical dissociation.
Fortunately (and this may be the first and last time that you'll ever hear this next phrase), our statisticians have made things a lot less awkward. One of the brave folks in Minitab's R&D department toiled against all odds, and at considerable personal peril to solve this enigma. The result, which has been incorporated into Minitab, is an effective, elegant, and non-enigmatic test that we call Bonett's test.

Like Levene's test, Bonett's test can be used with nonnormal data. But unlike Levene's test, Bonett's test is actually based on the actual standard deviations of the actual samples. Which means that Bonett's test is not subject to the same awkward and confusing paradoxical dissociations that can accompany Levene's test. And I don't know about you, but I try to avoid paradoxical dissociations whenever I can. (Especially as I get older, ... I just don't bounce back the way I used to.)
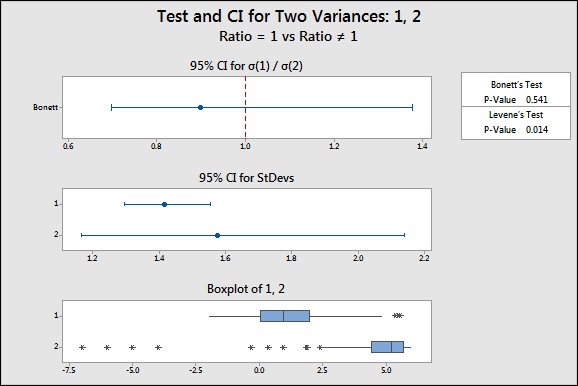
When you compare two standard deviations in Minitab, you get a handy graphical report that quickly and clearly summarizes the results of your test, including the point estimate and the CI from Bonett's test. Which means no more awkward and confusing paradoxical dissociations.

------------------------------------------------------------
1 So, that bit about the name of the F-test—I kind of made that up. Fortunately, there is a better source of information for the genuinely curious. Our white paper, Bonett's Method, includes all kinds of details about these tests and comparisons between the CIs calculated with each. Enjoy.


