In my last post on DMAIC tools for the Define phase, we reviewed various graphs and stats typically used to define project goals and customer deliverables. Let’s now move along to the tools you can use in Minitab Statistical Software to conduct the Measure phase.
Measure Phase Methodology
The goal of this phase is to measure the process to determine its current performance and quantify the problem. This includes validating the measurement system and establishing a baseline process capability (i.e., sigma level).
I. Tools for Continuous Data
Gage R&R
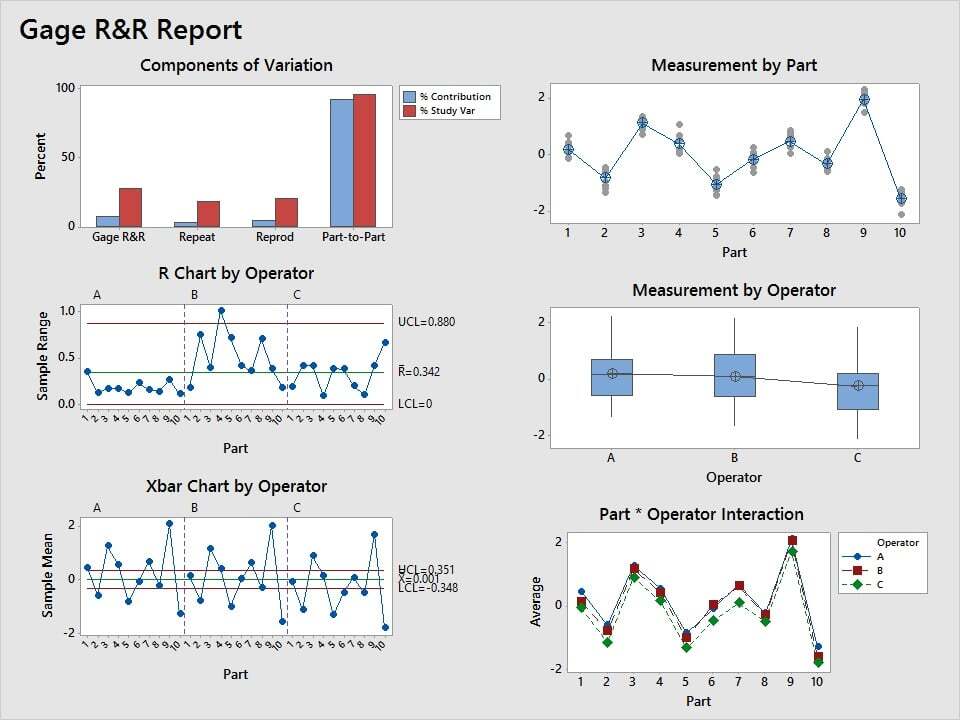
Before you analyze your data, you should first make sure you can trust it, which is why successful Lean Six Sigma projects begin the Measure phase with Gage R&R. This measurement systems analysis tool assesses if measurements are both repeatable and reproducible. And there are Gage R&R studies available in Minitab for both destructive and non-destructive tests.
Minitab location: Stat > Quality Tools > Gage Study > Gage R&R Study OR Assistant > Measurement Systems Analysis.
Gage Linearity and Bias
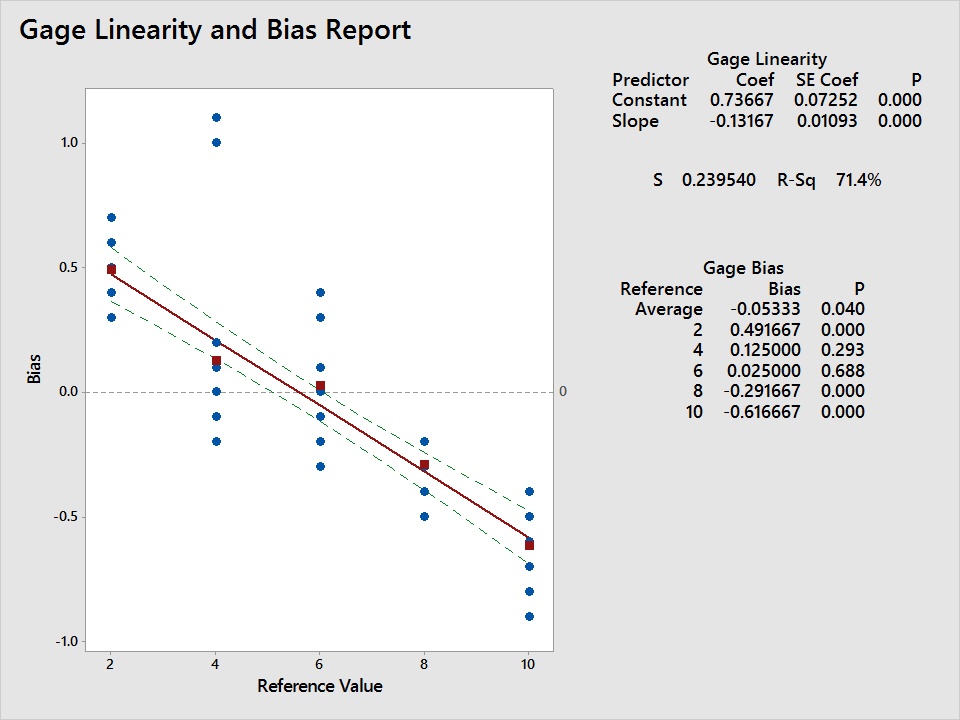
When assessing the validity of our data, we need to consider both precision and accuracy. While Gage R&R assesses precision, it’s Gage Linearity and Bias that tells us if our measurements are accurate or are biased.
Minitab location: Stat > Quality Tools > Gage Study > Gage Linearity and Bias Study.
Distribution Identification
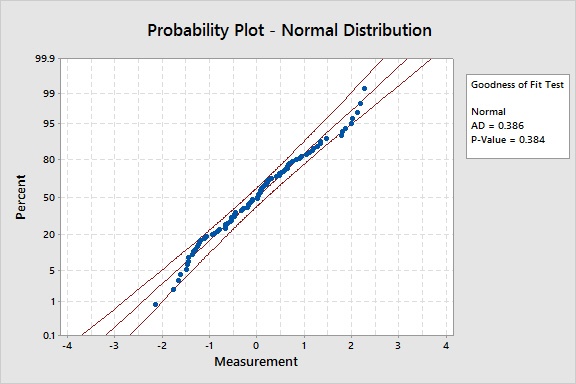
Many statistical tools and p-values assume that your data follow a specific distribution, commonly the normal distribution, so it’s good practice to assess the distribution of your data before analyzing it. And if your data don’t follow a normal distribution, do not fear as there are various techniques for analyzing non-normal data.
Minitab location: Stat > Basic Statistics > Normality Test OR Stat > Quality Tools > Individual Distribution Identification.
Capability Analysis
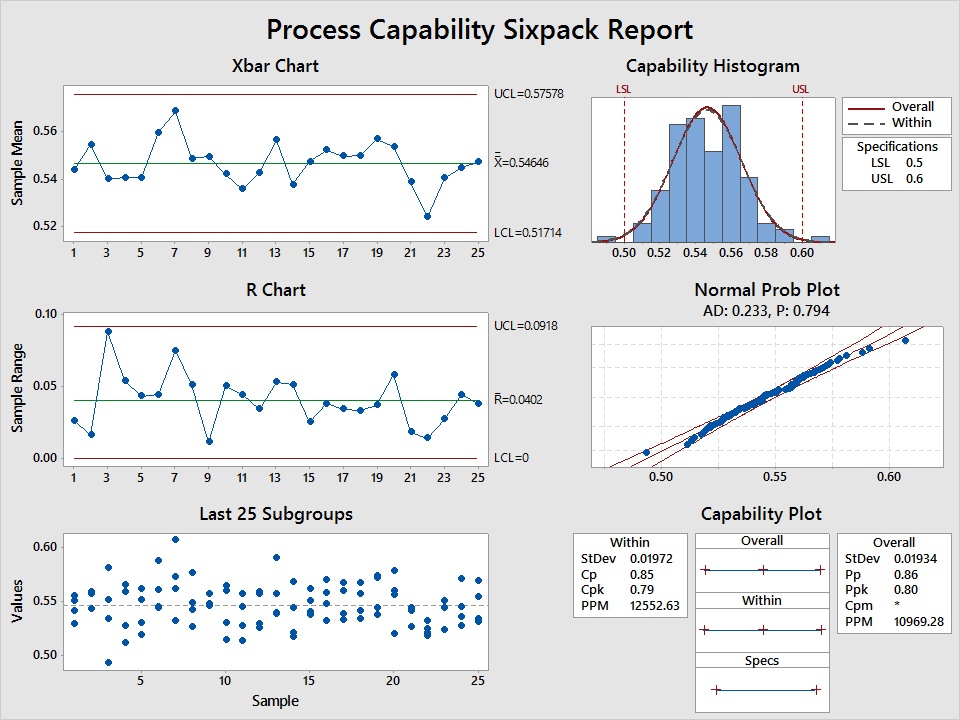
Capability analysis is arguably the crux of “Six Sigma” because it’s the tool for calculating your sigma level. Is your process at a 1 Sigma, 2 Sigma, etc.? It reveals just how good or bad a process is relative to specification limit(s). And in the Measure phase, it’s important to use this tool to establish a baseline before making any improvements.
Minitab location: Stat > Quality Tools > Capability Analysis/Sixpack OR Assistant > Capability Analysis.
II. Tools for Categorical (Attribute) Data
Attribute Agreement Analysis
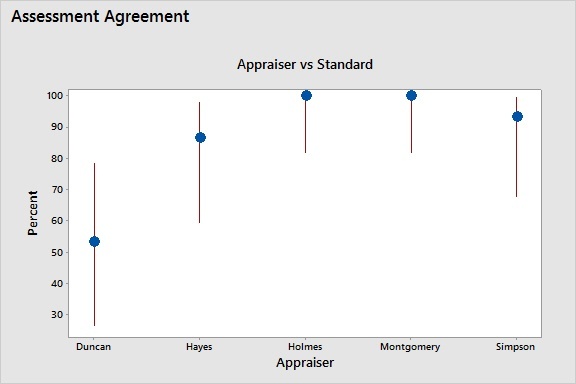
Like Gage R&R and Gage Linearity and Bias studies mentioned above for continuous measurements, this tool helps you assess if you can trust categorical measurements, such as pass/fail ratings. This tool is available for binary, ordinal, and nominal data types.
Minitab location: Stat > Quality Tools > Attribute Agreement Analysis OR Assistant > Measurement Systems Analysis.
Capability Analysis (Binomial and Poisson)
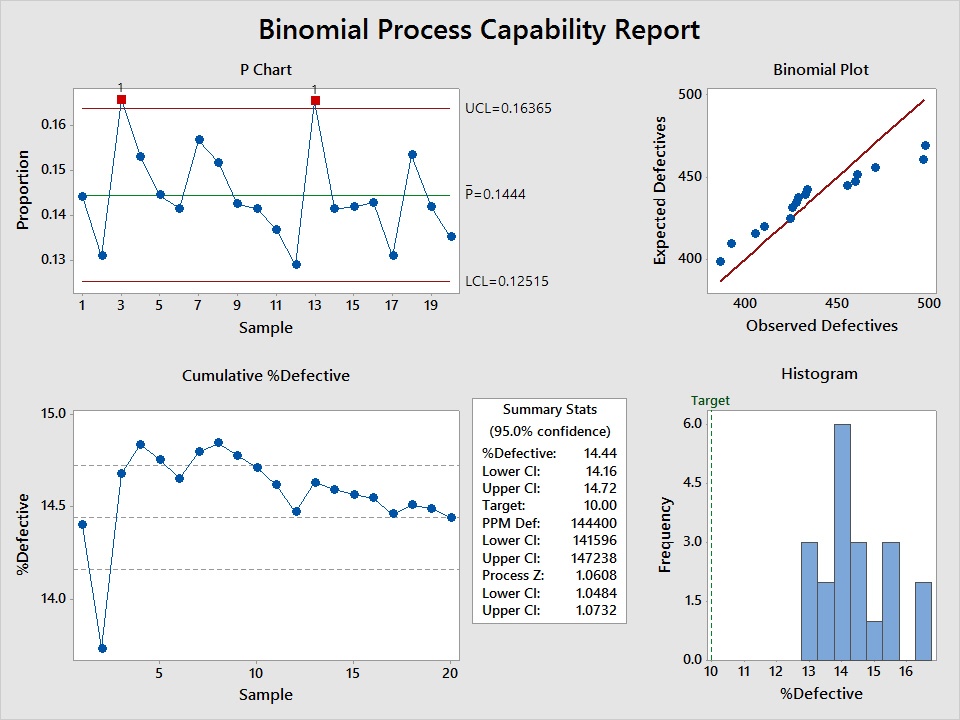
If you’re counting the number of defective items, where each item is classified as either pass/fail, go/no-go, etc., and you want to compute parts per million (PPM) defective, then you can use binomial capability analysis to assess the current state of the process.
Or if you’re counting the number of defects, where each item can have multiple flaws, then you can use Poisson capability analysis to establish your baseline performance.
Minitab location: Stat > Quality Tools > Capability Analysis OR Assistant > Capability Analysis.
Variation is Everywhere
As I mentioned in my last post on the Define phase, Six Sigma projects can vary. Every project does not necessarily use the same identical tool set every time, so the tools above merely serve as a guide to the types of analyses you may need to use. And there are other tools to consider, such as flowcharts to map the process, which you can complete using Minitab Engage.


