


The two previous posts in this series focused on manipulating data using Minitab’s calculator and the Data menu.
In this third and final post, we continue to explore helpful features for working with text data and will focus on some features in Minitab’s Editor menu.
Using the Editor Menu
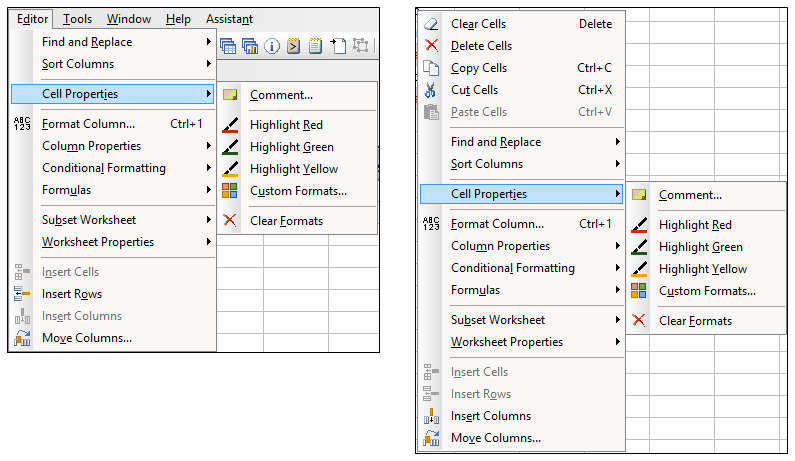
The Editor menu is unique in that the options displayed depend on what is currently active (worksheet, graph, or session window). In this blog post, we’ll focus on some of the options available when a worksheet is active. Here's the Editor menu in Minitab 18:
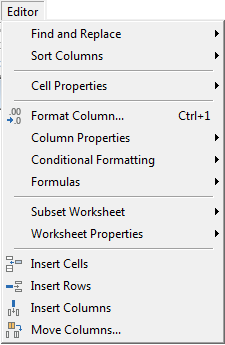
There is also some duplication between the Data menu, which was the focus of my previous post, and the Editor menu: both menus provide the option for Conditional Formatting. The same conditional formatting options can now be accessed via either the Data or the Editor menus.
Let's consider some examples using features from Find and Replace (Find/Replace Formatted Cell Value), Cell Properties (Comment, Highlight & Custom Formats), Column Properties (Value Order) and Subset Worksheet (Custom Subset).
Find and Replace
This section of the Editor menu includes options for Find Format and Replace Formatted Cell Value—either selection will display the Find Format and Replace Value dialog box:
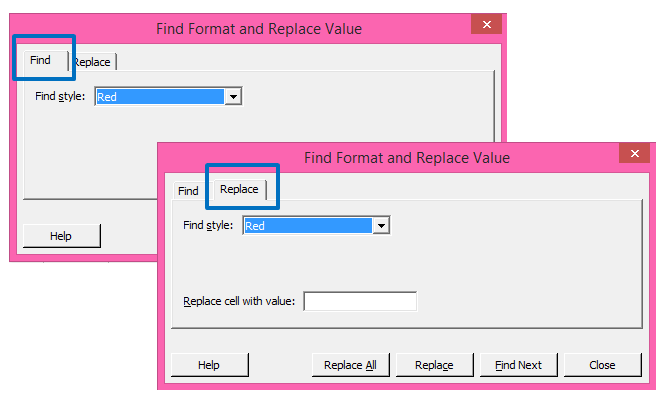
We can toggle between the two options by using the Find and the Replace tabs at the top.
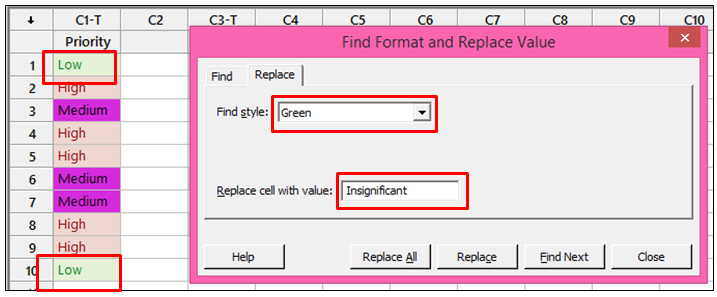
Both of these options could be useful when making changes to a worksheet that has been formatted using the new conditional formatting options discussed in the previous post in this series.
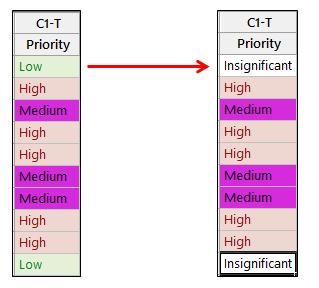
For example, if we’ve applied conditional formatting to a worksheet to highlight cells with the value ‘Low’ in green, we could use the Replace tab to find all the cells that are green and replace the values in the cells with new values. For example, we can replace the ‘Low’ values that are marked in green with the new value ‘Insignificant’:
Cell Properties
The new Cell Properties option in the Editor menu provides options for adding a Comment to the selected cell, to Highlight specific cells in the worksheet, and to create Custom Formats. These same options can be accessed by right-clicking on a cell and choosing Cell Properties:
The ability to add a comment to a specific cell is new. In previous versions of Minitab it was possible to add a comment to a worksheet or column only. Now we can select the Comment option to add a comment to a cell:
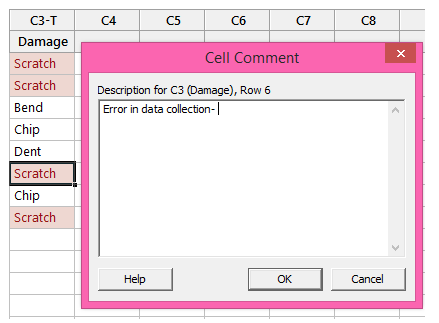
Notice that the top of the window confirms where the comment will be added. In the example above, it will be in C3 in row 6.
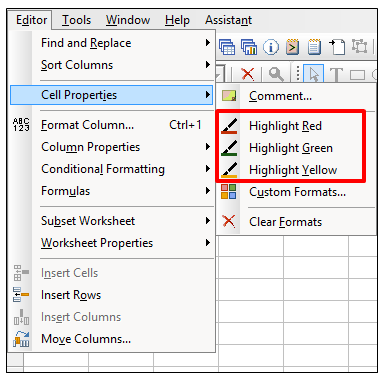
Similar to conditional formatting, we can use the Highlight options to highlight only the selected cell or cells:
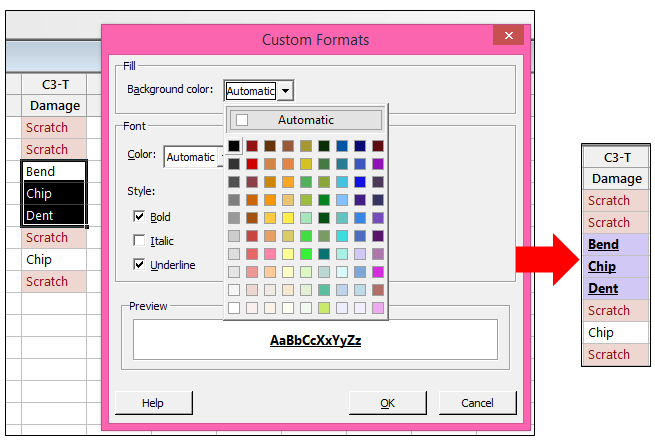
Finally, the Custom Formats option allows us flexibility in terms of the fill color, font color, and style for the selected cell or cells:
Column Properties
This option in the Editor menu allows us to control the order of text strings in a column. For example, if I create a bar chart using Graph > Bar Chart > Counts of Unique Values using the data in column 1 below, the default output is in alphabetical order:
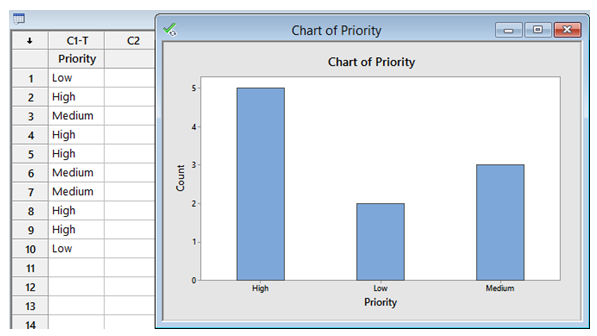
In some cases, it would be more intuitive to display the order of the bars beginning with Low, then Medium, then High- that is where the Editor menu can help.
First, we click in any cell in column 1 so that the column we want to modify is active, then we select Editor > Column Properties > Value Order:
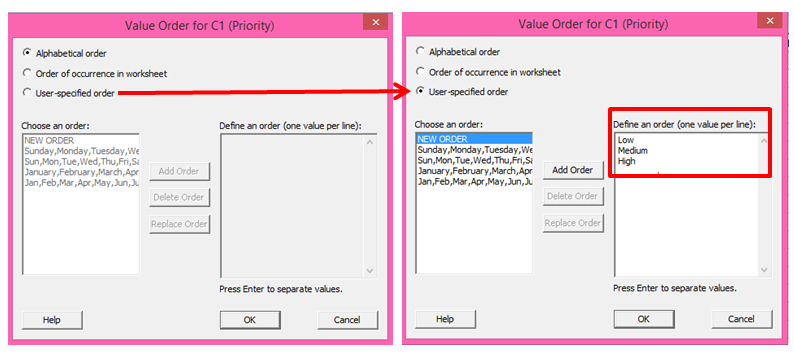
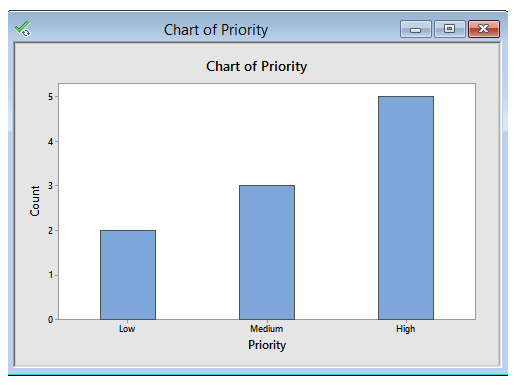
To change the alphabetical order default, we select the radio button next to User-specified order, and then edit the order under Define an order and click OK. Now the default order will be Low, Medium, High, and we can update our bar chart to reflect that change:
Subset Worksheet
One of the best new enhancements to the Editor menu gives us the ability to quickly and easily create a subset of a worksheet without having to manually type a formula into the calculator.
For example, we may want to create a new worksheet that excludes items that are marked as Low priority. To do that, we can use Editor > Subset Worksheet > Custom Subset:
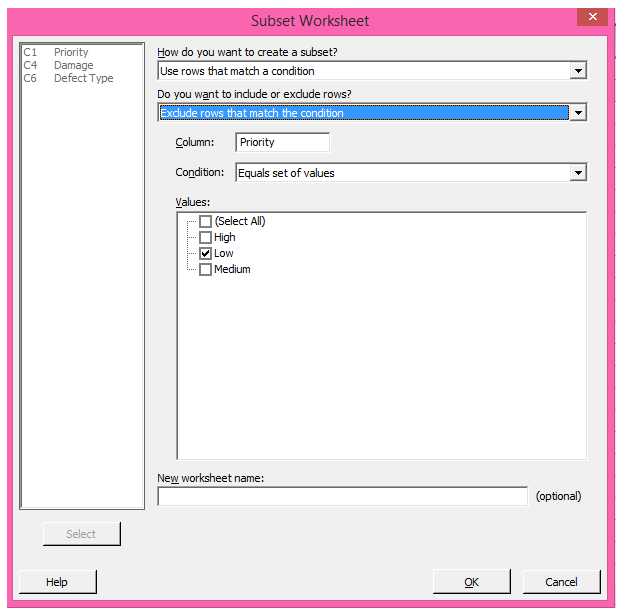
In this example, we’re telling Minitab that we want to use a condition when we subset- we want to Exclude rows that match our condition. Our condition is based on the column Priority. When we introduce that text column, Minitab automatically shows all the unique values in that column. We select Low as the value we want to exclude from the new worksheet, and then click OK. It’s that simple- no need to guess whether we need to type in single or double-quotes in the subset condition!
I hope this series of posts on working with text data has been useful. If you have an older version of Minitab and would like to use the new features described in these posts, you can download and install the free 30-day trial and check it out!