


If you are not a programmer, it might seem daunting to try and use predictive analytics to identify what is causing failures in a process.
We are about to show you this does not need to be the case! This is our second blog about easier ways to use programming languages, aided by Minitab’s integrations with R and Python. Read the first example, creating Python-based visualizations, here.
In this blog we are going to explore how to build a Neural Network in Minitab using R - to compliment and compare with results from our own Predictive Analytics module.
What is R?
R is an open-source programming language that may be used to execute a number of data-related tasks such as data transformation, modelling, and visualization. R has a catalogue of libraries for data and statistical analysis, as well as machine learning algorithms, although it is dependent on the user's ability to understand the syntax.
Why Integrate R with Minitab?
Minitab Statistical Software is the go-to tool for professionals trying to reduce defects. It provides both statistical and predictive analytics in an easy-to-use interface.
Through Minitab Statistical Software integration, you can utilize R scripts which can be extremely powerful. This simplifies the process of what is often difficult to deploy for non-R programmers. Our integration allows access to R scripts to a wider range of people, multiplying the benefits they can yield.
Minitab Statistical Software’s desktop application offers a bespoke package for R integration, called mtbr. Find out more at https://support.minitab.com/en-us/minitab/21/integration/.
How to Use the R Programming Language to Build Neural Networks in Minitab
The Scenario:
Susan is a quality engineer working at a parts manufacturing company. They have been experiencing quality issues with one of their products recently - with many failed batches leading to increased costs and a backlog of orders.
The Challenge:
Susan’s task is to find ways to reduce the defect rate for the process. She fortunately has data on the production parameters and whether each batch passed or failed.
Susan’s idea is to use predictive analytics to try and understand:
- Which production parameters influence the chance of a defect batch?
- At what level do they need to maintain these parameters to minimize the chance of a failed batch?
She wants to try a variety of predictive analytics models to find the one which works best for her data.
Fortunately, Susan has a choice of regression models and CART® in her Minitab Statistical Software, as well as the Random Forests® and TreeNet® models offered in the Predictive Analytics add-on.
The Curveball
Not so fast Susan! Her boss has heard of Neural Networks and wants to try using them, but that is not part of Minitab – fortunately, R is able to build Neural Networks.
Since Susan is not an experienced R user, thankfully she can run the R script within Minitab’s R integration. This will provide several advantages.
Minitab’s R integration will make the whole process easier for her by keeping all the data and output in Minitab.
Rather than running her analyses separately on two different programs, Susan can run everything in Minitab and easily compare the performance and results of the different models.
From there, Susan can easily put together a presentation for her manager by exporting all Minitab output (tables, graphs etc...) to a PowerPoint presentation.
Tutorial: Performing the Analysis
So how does Susan conduct her analysis with Minitab’s Predictive Analytics and R integration?
First, she loads the data into Minitab. Her company uses Minitab Connect to automatically collect the production data from various data-sources, so she can easily load this data into Minitab.

Once the data is loaded into Minitab, she is ready to get started! First, let’s take a look at the data.

The idea is to use the data in columns C1 to C8 to understand whether or not a batch will fail (Defects columns equals 1). She will use the models available in Minitab.
To do this, she chooses Automated Machine Learning from Minitab®. This will use all of Minitab’s models on the dataset, and then select the one which performs the best, savings lots of time.
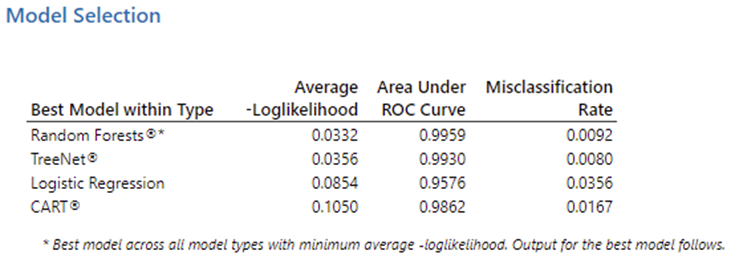
The best models available in Minitab are the Random Forests and TreeNet models. The TreeNet model has the best misclassification rate, 0.8% (0.008) – this means that only 0.8% of its predictions of whether a batch will pass or fail are incorrect. Susan chooses the TreeNet model since it provides more useful and informative output than Random Forests.
Next, it’s time to fit a Neural Network in R, using Minitab’s R integration. Here’s a sample of the script.

As part of the output we can visualize the Neural Network.

The input layer on the left (first row of nodes) receives information from each of the eight input variables. Above each line are the synaptic weights, they influence the next layer of the network. There is one hidden layer made up of two neurons and the blue circles represent bias, which corresponds to the intercept in a standard regression model, it is the hidden layer where the magic happens! The output neuron over on the right-hand side represents the Defects variable.
The script is saved as an R script (.R), to execute it within Minitab we use the command RSCRIPT followed by the name of the script in quotation marks.
The model has a misclassification error of 7%, which is not as accurate as the TreeNet model – and so Susan decides to use the TreeNet model.
Next, she uses the TreeNet output to understand which parameters are most influential in causing a defective batch. One of the benefits of the Minitab models is they provide a lot of supplementary information (such as the graphs below) as standard, making it easier to understand what the model means to you.

O2, Production Rate, Caustic and MgSO4 all seem to have a large effect on the defect rate. To help make things better, Susan must understand the way in which these parameters are having an effect. The TreeNet output can help with this.
-Jul-06-2025-12-02-16-8668-AM.png?width=500&height=333&name=a%20(1)-Jul-06-2025-12-02-16-8668-AM.png)
So, at what level do they need to control these parameters to minimize the chance of a failed batch?
Where we see higher values on the graph there is a lower chance of a defective batch. Based on these plots, it shows that:
- O2 should be maintained between 20.5 and 22%
- Lower Production Rates produce a lower defect rate
- Caustic should be maintained between 60 and 70%
- MgSO4 values above 6% result in a lower chance of batch failure
Based on this, Susan implements control plans for each of the influential parameters, to control them in an area which keeps the chances of a defective batch nice and low.
The defect rate is reduced, everyone is super happy, and Susan gets a promotion 🤩👌
Finally, want to try this analysis for yourself?
You can download the dataset and the R script here.
Here’s a link to our support pages on the R integration with Minitab.
And here’s a video that takes you through the installation steps, as well as testing R in Minitab and then running the Neural Net R script in Minitab.
-1-Jul-06-2025-12-02-19-0377-AM.png?width=600&height=336&name=Capture%20(1)-1-Jul-06-2025-12-02-19-0377-AM.png)