


When data are collected in subgroups, it’s easy to understand how the variation can be calculated within each of the subgroups based the subgroup range or the subgroup standard deviation.
When data is not collected in subgroups (so the subgroup size is 1), it may be a little less intuitive to understand how within-subgroup standard deviation is calculated. How does Minitab Statistical Software calculate within-subgroup variation if there is only one data point in each subgroup? How does this affect Cpk? This blog post will discuss how within-subgroup variation and Cpk are calculated when the subgroup size is 1.
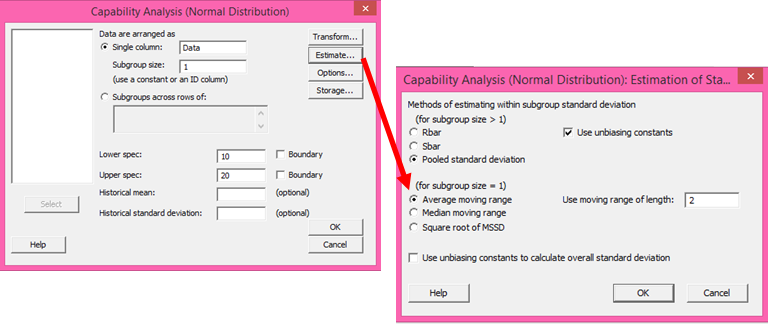
For this post, the data linked here will be used with along with a lower spec of 10 and an upper spec of 20 (sorry, no back story to this data). We will also accept Minitab’s default method for calculating within-subgroup variation for when the subgroup size is 1, which is the average moving range.
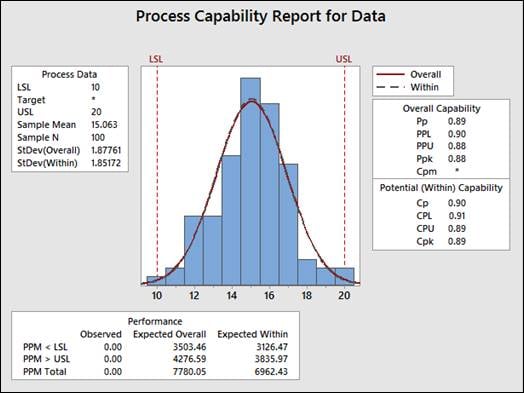
The normal capability results below show that for this dataset, the within-subgroup standard deviation is 1.85172 and the Cpk is 0.89:
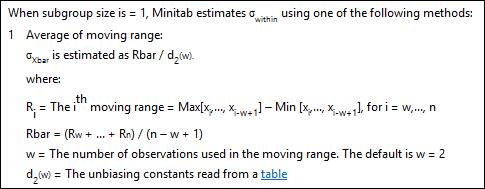
To find the formulas Minitab uses to calculate the average moving range, we navigate the following menu path in Minitab: Help > Methods and Formulas > Process capability > Process capability (Normal). The section titled Estimating standard deviation shows the formula for the average moving range:
We’ll use the formula above (and link to the table of unbiasing constants) to replicate Minitab’s Cpk output for a normal capability with a subgroup size of 1.
First, we calculate Rbar. To do that, we’ll get the average of the moving ranges, by calculating the difference from the data point in row 1 to row 2, row 2 to row 3, and so forth. An easy way to do that in Minitab is to use the Lag function in the Time Series menu- we choose Stat > Time Series > Lag, and then complete the dialog box as shown below and click OK:
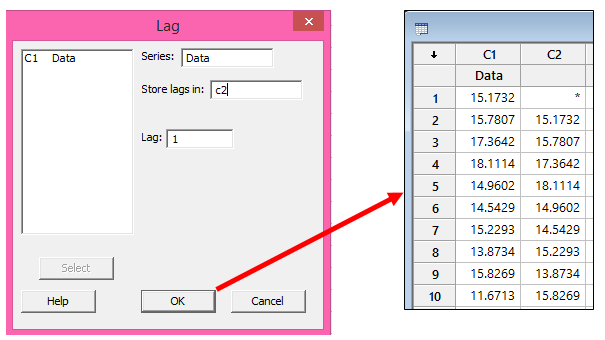
The lag function shifts every row down by the number of rows we type in the Lag field above.
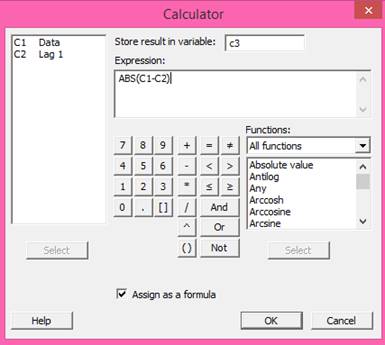
Now we can use Calc > Calculator to subtract C2 from C1 and store the differences in a new column. Because the formula tells us to take the Max minus the Min values and we don’t want to rearrange the data, we can just use the ABS function in the calculator to get the absolute values of the differences:
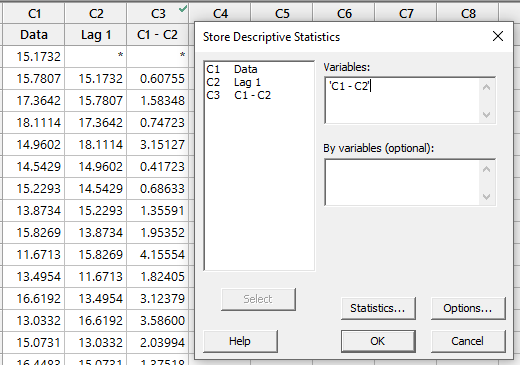
Next we can use Stat > Basic Statistics > Store Descriptive Statistics to store the Sum of the differences that we calculated in the previous step:
The value stored in the worksheet, 206.785, is the numerator for our R-bar calculation. Now we can plug that number into the formula from Methods and Formulas:
Rbar = (Rw + ... + Rn) / (n - w + 1)
w = The number of observations used in the moving range. The default is w = 2
Rbar = (206.785) / (100 - 2 + 1) = 2.08874
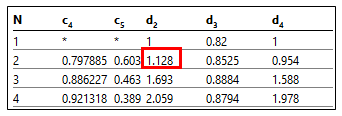
Finally, we can find the value of the unbiassing constant (d2) using the table linked in Methods and Formulas. In this example, w = 2, and d2(w) = 1.128:
To calculate sigma x-bar, we use the formula from Methods and Formulas, dividing our Rbar estimate by the d2 value from the table (I used Minitab’s calculator again to get the answer):
Sigma x-bar = 2.08874/1.128 = 1.85172 – that matches Minitab’s capability output, so we’re almost there!
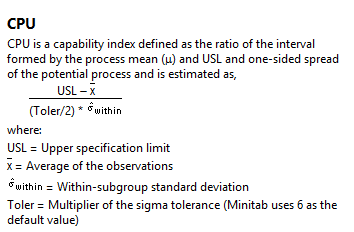
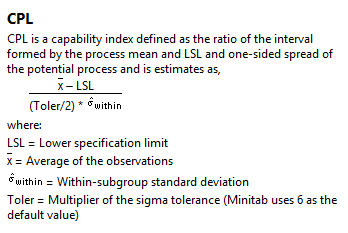
Now we can calculate Cpk, which is the lesser of CPU and CPL. Once again Methods and Formulas tells us how to calculate CPU and CPL:
 |
 |
We can get the sample mean, X-bar, from Minitab’ capability output or by using Stat > Basic Statistics > Store Descriptive Statistics. That X-bar value along with the other values we’ve calculated are plugged in the above formulas:
CPU = (20-15.063)/(3*1.85172) = 0.89
CPL = (15.063-10)/(3*1.85172) = 0.91
Since Cpk is the lesser of CPU and CPL, then Cpk = 0.89, just like Minitab said!
I hope this post on calculating Cpk when the size of the subgroup is 1 was helpful. You may also be interested in learning how Minitab calculates Cpk when the subgroup size is greater than 1.