


Many of the things you need to monitor can be measured in a concrete, objective way, such as an item's weight or length. But, many important characteristics are more subjective, such as the collaborative culture of the workplace, or an individual's political outlook.
A survey is an excellent way to measure these kinds of characteristics. To better understand a characteristic, a researcher asks multiple questions about it. For example, rather than simply ask diners whether they are satisfied, a researcher may ask:
- How satisfied are you with our services?
- How likely are you to visit our restaurant again?
- How likely are you to recommend our restaurant?
Collectively, these questions give the researcher a deeper, more nuanced understanding of customer satisfaction than a single question.
The challenge is to ask questions that vary enough to measure the different facets of the characteristic, yet still relate to the same characteristic. If you ask questions that don't measure the same characteristic, your survey will produce misleading data, which can lead you to make poor, and potentially costly, decisions. So, how do you know whether different questions all measure the same characteristic?
Item Analysis with Cronbach's alpha can help, and it's easy to do in Minitab's statistical software.
What Is Item Analysis?
Item Analysis tells you how well a set of questions (or items) measures one characteristic (or construct) and helps to identify questions that are problematic.
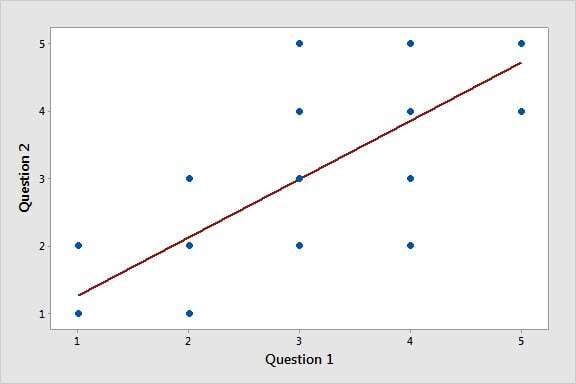
For example, two questions measure different aspects of quality on a Likert scale (1 is worst, 5 is best). For the most part, respondents who rated Question 1 high also rated Question 2 high. And, those who rated Question 1 low tended to rate Question 2 low. This correlation suggests these questions measure the same characteristic, and so comprise a reliable survey.
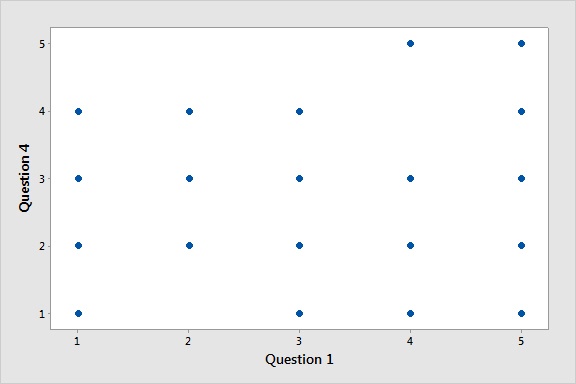
However, for Question 1 and Question 4, respondents gave markedly different ratings. This lack of a correlation indicates that the items do not measure the same characteristic.
Cronbach's alpha and other key statistics
Item Analysis helps you to evaluate the correlation of related survey items with only a few statistics. Most important is Cronbach's alpha, a single number that tells you how well a set of items measures a single characteristic. This statistic is an overall item correlation where the values range between 0 and 1. Values above 0.7 are often considered to be acceptable.
To identify problematic items, look at the Omitted Item Statistics section of the output. This section tells you how removing any one item from the analysis improves or worsens Cronbach's alpha. This information allows you to fine-tune your survey, keeping the good questions while replacing the bad.
Trust your data
Suppose a bank surveys customers to assess customer satisfaction.
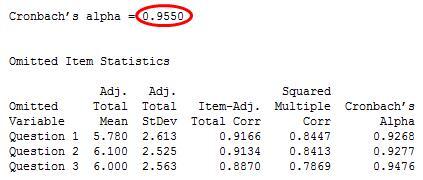
Analysts use Item Analysis to determine how well all of the questions measure customer satisfaction. The results show that Cronbach's alpha is quite high: 0.9550. The bank can trust the three questions in the survey reliably assess the same construct, customer satisfaction.
Reveal an unreliable survey
Now suppose a medical group surveys patients who are in physical rehabilitation to assess their degree of mobility.
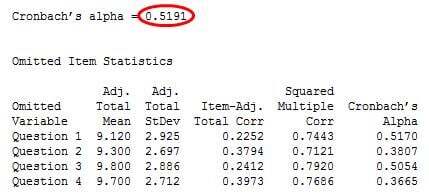
Analysts use Item Analysis to determine whether all of the questions measure mobility. The results show that Cronbach's alpha is quite low: 0.5191. This value suggests the questions do not all measure mobility.
Identify a problematic question
Item Analysis provides more than just a passing or failing grade; it also helps you identify problematic questions.
Suppose a manufacturing company surveys its employees to assess the strength of the safety culture in its factories. The survey asks the respondents to indicate the strength of their agreement with statements such as the following:
- When a safety mistake is made but no one is harmed, the mistake is usually reported.
- My supervisor wants us to work faster, but not by taking shortcuts on safety.
- Our procedures and systems are good at preventing errors.
- I feel that I am safe at work.
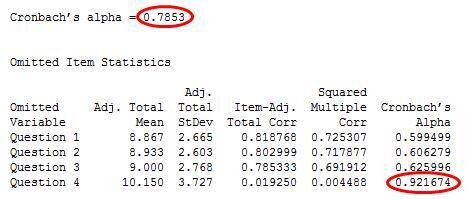
Cronbach's alpha is above 0.7, which is promising. However, looking at the Omitted Item Statistics output shows us that Cronbach's alpha increases from 0.7853 to 0.921674 when Minitab removes Question 4 from the analysis.
Collectively, the results suggest that Questions 1, 2, and 3 are the best indicators of the safety culture. The manager should remove Question 4 from the analysis and possibly replace it in future surveys.
Conducting an Item Analysis in Minitab
Analyzing your own survey data is easy.
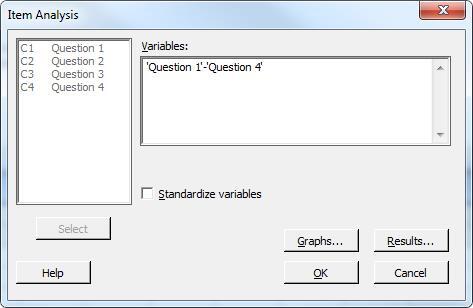
- Choose Stat > Multivariate > Item Analysis.
- In Variables, enter all items which measure the same construct.
- If your items are measured on different scales, check Standardize variables.
- Click OK.
Putting Item Analysis to Use
Surveys and tests are like any other measurement tool—you first need to assess whether your data are reliable. Minitab's Item Analysis evaluates your survey responses so you can trust your data and be confident in the decisions you make as a result.