


As we start off 2018, our eyes are on the winter weather, specifically low temperatures and snowfall. After 2015-2016's warmest winter on record and Chicago breaking records in 2017 with no snow sticking to the ground in January or February, our luck might have run out. We shall see, though. The Old Farmer's Almanac is reporting that 2017-2018 winter temperatures will be colder than last winter.
If you live in the United States, you might know the winter of 2014-2015 was one for the record books. In fact, more than 90 inches of snow fell in Boston in the winter of 2015! Have you ever wondered how likely of an occurrence this was?
Dr. Diane Evans, Six Sigma Black Belt and professor of engineering management at Rose-Hulman Institute of Technology, and Thomas Foulkes, National Science Foundation Graduate Research Fellow in the electrical and computer engineering department at the University of Illinois at Urbana-Champaign, also wondered. They set out to explore the rarity of the 2015 Boston snowfall by examining University of Oklahoma meteorologist Sam Lillo’s estimate of the likelihood of this event occurring. Below I’ll outline some points from their article, A Statistical Analysis of Boston’s 2015 Record Snowfall.
Meteorologist’s Analysis of Boston’s Historic Snowfall in The Washington Post
Following this historic snowfall of 94.4 inches in a 30-day period in 2015 Lillo analyzed historical weather data from the Boston area from as far back as 1938 in order to determine the rarity of this event.
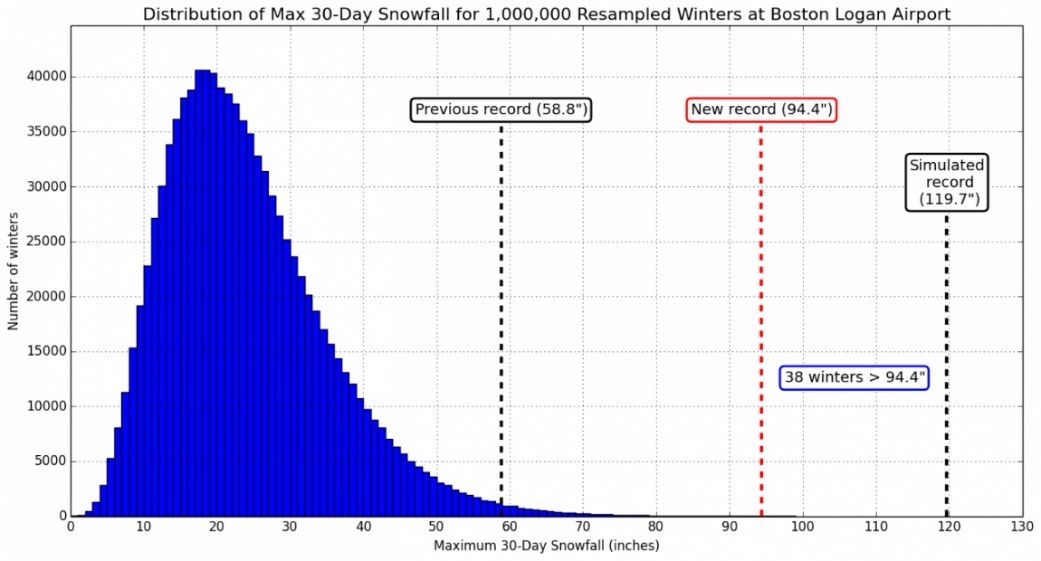
Lillo developed a simulated set of one million hypothetical Boston winters by sampling with replacement snowfall amounts gathered over 30-day periods. Eric Holthaus, a journalist with The Washington Post, reported that Lillo’s results indicated that winters like the 30 days of consecutive snowfall from January 24 to February 22, 2015 should “only occur approximately once every 26,315 years” in Boston:
To assess Lilo’s findings, Evans and Foulkes obtained snowfall amounts in a specified Boston location from 1891 to 2015 via the National Oceanic and Atmospheric Administration (NOAA) for comparison with his simulated data.
Recreating the Simulated Data
On March 15, 2015, the cumulative Boston snowfall of 108.6 inches surpassed the previous Boston record of 107.6 inches set in the winter of 1996. In the figure below, a graphical display of Boston snow statistics from 1938 to 2015 illustrates the quick rise in snowfall amounts in 2015 as compared to record setting snowfalls in years 1996, 1994, and 1948:
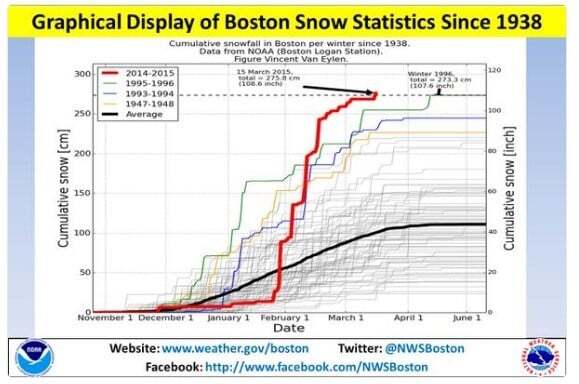
Also included in the figure is the annual average Boston snowfall through early June. The final tally on Boston’s brutal snowfall in 2015 clocked in at 110 inches!
The dashed rectangular region inserted in the graphic highlights the 30 days of snowfall from January 24 to February 22, 2015, which resulted in 94.4 inches of snow. In order to obtain hypothetical 30-day Boston snowfall amounts, Lillo first generated one million resampled winters by:
... stitching together days sampled from past winters. A three-day period was chosen, to represent the typical timescale of synoptic weather systems. In addition, to account for the effect of long-term pattern forcing, the random selection of 3-day periods was weighted by the correlation between consecutive periods. Anomalies tended to persist across multiple periods, such that there’s a better chance that a snowier than normal three days would follow a similarly snowy three days. This is well observed (and in extreme cases, like this year), so it’s important to include in the simulation.
After generating the one million resampled winters, Lillo recorded the snowiest 10-period stretches, i.e., 30 days, from each winter. Percentile ranges of the resampled distribution were compared to the distribution of observed winters to check the validity of the simulated data. In simulating the winters’ snowfalls in this manner, Lillo had to assume that consecutive winters and winter snow patterns within a particular year were independent and identically distributed (IID). Evans and Foulkes recognize that these assumptions are not necessarily valid.
Since they were unable to obtain Lillo’s simulated data and used actual historical data for their own Sigma Level calculations, Evans and Foulkes used a digitizer and the graphical display of Boston snow statistics above to simply create a “copy” of his data for further analysis.
Once they had data values for “Maximum 30-day snowfall (inches)” and “Number of winters,” they added them to Minitab and created histograms of the snowfall amounts with overlaid probability plots to offer reasonable distributions to fit the data.