---
title: How to Use Brushing to Investigate Outliers on a Graph
description: How to Use Brushing to Investigate Outliers on a Graph
image: https://blog.minitab.com/hubfs/B2BML%20-%20NEW%20FILE%20MANAGER%20STRUCTURE/Blog%20Images/Imported_Blog_Media/oecd_member_nations_w640-3.png
---
English
- [English](https://blog.minitab.com/en/?hsLang=en)
- [Français](https://blog.minitab.com/fr/?hsLang=en)
- [Deutsch](https://blog.minitab.com/de/?hsLang=en)
- [Português](https://blog.minitab.com/pt/?hsLang=en)
- [Español](https://blog.minitab.com/es/?hsLang=en)
- [日本語](https://blog.minitab.com/ja/?hsLang=en)
- [한국어](https://blog.minitab.com/ko/?hsLang=en)
- [中文(简体)](https://blog.minitab.com/zh/?hsLang=en)
- [ Partners](https://www.minitab.com/en-us/company/partners/)
- [ Contact](https://www.minitab.com/en-us/company/contact-us/)
- [ Talk to Minitab](https://www.minitab.com/en-us/talk-to-minitab/)
- [ My Account](https://licensing.minitab.com/account/manage)
[](https://www.minitab.com/en-us/)
- Products
Back
[Products](https://www.minitab.com/en-us/products/)
[All Products](https://www.minitab.com/en-us/products/)
- [Minitab Solution Center](https://www.minitab.com/en-us/products/minitab-solution-center/)
- [Minitab Statistical Software](https://www.minitab.com/en-us/products/minitab/)
- [Minitab Connect](https://www.minitab.com/en-us/products/connect/)
- [Minitab Model Ops](https://www.minitab.com/en-us/products/model-ops/)
- [Minitab Education Hub](https://www.minitab.com/en-us/products/education-hub/)
- [Minitab Engage](https://www.minitab.com/en-us/products/engage/)
- [Minitab Workspace](https://www.minitab.com/en-us/products/workspace/)
- [Real-Time SPC](https://www.minitab.com/en-us/products/real-time-spc/)
- [Prolink Data Collection & SPC](https://www.minitab.com/en-us/products/prolink)
- [Simul8 Discrete Event Simulation](https://info.minitab.com/en/new-to-simul8?hsLang=en)
- [SPM](https://www.minitab.com/en-us/products/spm/)
- Solutions
Back
[Solutions](https://www.minitab.com/en-us/solutions/)
[All Solutions](https://www.minitab.com/en-us/solutions/)
- [Analytics](https://www.minitab.com/en-us/solutions/analytics/)
- [Statistics & Predictive Analytics](https://www.minitab.com/en-us/solutions/analytics/statistical-analysis-predictive-analytics/)
- [Data Science & Machine Learning](https://www.minitab.com/en-us/solutions/analytics/data-science-machine-learning/)
- [Business Analytics & Intelligence](https://www.minitab.com/en-us/solutions/analytics/business-analytics-intelligence/)
- [Statistical Process Control](https://www.minitab.com/en-us/solutions/analytics/statistical-process-control/)
- [Quality Analytics](https://www.minitab.com/en-us/solutions/analytics/quality-analytics/)
- [Live Analytics](https://www.minitab.com/en-us/solutions/analytics/live-analytics/)
- [Reliability & Life Data Analysis](https://www.minitab.com/en-us/solutions/analytics/reliability/)
- [Discrete Event Simulation](https://info.minitab.com/en/new-to-simul8?hsLang=en)
- [Process Mining](https://info.minitab.com/en/new-to-simul8?hsLang=en)
- [Key Capabilities](https://www.minitab.com/en-us/solutions/key-capabilities/)
- [Continuous Improvement](https://www.minitab.com/en-us/solutions/key-capabilities/continuous-improvement/)
- [Data Integration & Data Prep](https://www.minitab.com/en-us/solutions/key-capabilities/data-integration-data-prep/)
- [Diagramming & Mind Mapping](https://www.minitab.com/en-us/solutions/key-capabilities/diagramming-mind-mapping/)
- [Digital Twins](https://info.minitab.com/en/new-to-simul8?hsLang=en)
- [Model Deployment & ML Ops](https://www.minitab.com/en-us/solutions/key-capabilities/model-deployment-ml-ops/)
- [Innovation & Project Management](https://www.minitab.com/en-us/solutions/key-capabilities/innovation-project-management/)
- [Process Excellence: Detect, Correct & Prevent](https://www.minitab.com/en-us/solutions/key-capabilities/process-excellence/)
- [Featured Industries](https://www.minitab.com/en-us/solutions/industry/)
- [Academic](https://www.minitab.com/en-us/solutions/industry/academic/)
- [Energy & Natural Resources](https://www.minitab.com/en-us/solutions/industry/energy-resources/)
- [Government & Public Sector](https://www.minitab.com/en-us/solutions/industry/government/)
- [Healthcare](https://www.minitab.com/en-us/solutions/industry/healthcare/)
- [Insurance](https://www.minitab.com/en-us/solutions/industry/insurance/)
- [Manufacturing & Industrial](https://www.minitab.com/en-us/solutions/industry/manufacturing-industrial/)
- [Services](https://www.minitab.com/en-us/solutions/industry/service-industries/)
- [Software & Technology](https://www.minitab.com/en-us/solutions/industry/software-technology/)
- [Construction](https://www.minitab.com/en-us/solutions/industry/construction/)
- [Featured Roles](https://www.minitab.com/en-us/solutions/role/)
- [Engineering](https://www.minitab.com/en-us/solutions/role/engineering/)
- [Business Analysis](https://www.minitab.com/en-us/solutions/role/business-analysts/)
- [Information Technology](https://www.minitab.com/en-us/solutions/role/information-technology/)
- [Supply Chain](https://www.minitab.com/en-us/solutions/role/supply-chain/)
- [Customer Service & Contact Center](https://www.minitab.com/en-us/solutions/role/customer-service-contact-center/)
- [Human Resources](https://www.minitab.com/en-us/solutions/role/human-resources/)
- [Marketing](https://www.minitab.com/en-us/solutions/role/marketing/)
- [Research and Development](https://www.minitab.com/en-us/solutions/role/research-and-development/)
- Resources & Services
Back
[Resources & Services](https://www.minitab.com/en-us/resources-services/)
[All Resources & Services](https://www.minitab.com/en-us/resources-services/)
- [Resources](https://www.minitab.com/en-us/resources-services/resources/)
- [Case Studies](https://www.minitab.com/en-us/resources-services/resources/case-studies/)
- [eBooks & White Papers](https://www.minitab.com/en-us/resources-services/resources/ebooks-and-white-papers/)
- [Blog](https://blog.minitab.com/blog/?hsLang=en)
- [Data Sets](https://www.minitab.com/en-us/resources-services/resources/data-set/)
- [Webinars & Events](https://www.minitab.com/en-us/resources-services/resources/events/)
- [Education Hub](https://www.minitab.com/en-us/resources-services/resources/education-hub/)
- [Services](https://www.minitab.com/en-us/resources-services/services/)
- [Training](https://www.minitab.com/en-us/resources-services/services/training/)
- [Deployment](https://www.minitab.com/en-us/resources-services/services/deployment/)
- [Consulting](https://www.minitab.com/en-us/resources-services/services/statistical-consulting/)
- [Self-Paced Learning](https://www.minitab.com/en-us/resources-services/services/self-paced-learning/)
- [Continuing Education](https://www.minitab.com/en-us/resources-services/services/continuing-education/)
- Support
Back
[Support](https://www.minitab.com/en-us/support/)
[Technical Support](https://www.minitab.com/en-us/support/)
- [Subscriptions & Activation](https://www.minitab.com/en-us/support/subscriptions-and-activation/)
- [Minitab Quick Start](https://www.minitab.com/en-us/support/quick-start/)
- [Training](https://www.minitab.com/en-us/resources-services/services/training/)
- [Installation Support](https://www.minitab.com/en-us/support/installation/)
- [Support Videos](https://www.minitab.com/en-us/support/videos/)
- [Support Documentation](https://www.minitab.com/en-us/support/documents/)
- [Software Updates](https://www.minitab.com/en-us/support/software-updates/)
- [Product Downloads](https://www.minitab.com/en-us/support/downloads/)
- [Support Policy](https://www.minitab.com/en-us/support/policy/)
- Company
Back
[Company](https://www.minitab.com/en-us/company/)
[Company](https://www.minitab.com/en-us/company/)
- [About Us](https://www.minitab.com/en-us/company/our-company/)
- [Leadership Team](https://www.minitab.com/en-us/company/leadership-team/)
- [Partners](https://www.minitab.com/en-us/company/partners/)
- [Careers](https://www.minitab.com/en-us/company/careers/)
- [Contact](https://www.minitab.com/en-us/company/contact-us/)
- [News](https://www.minitab.com/en-us/company/press-releases/)
[Try/Buy](https://www.minitab.com/en-us/try-buy/)
- [Statistics](https://blog.minitab.com/en/blog/tag/statistics)
- [Data Analysis](https://blog.minitab.com/en/blog/tag/data-analysis)
-
- [Quality Improvement](https://blog.minitab.com/en/blog/tag/quality-improvement)
- [Subscribe](https://info.minitab.com/blog/subscribe?hsLang=en)

## Notice
You are now leaving minitab.com.
Click Continue to proceed to:
Continue
Go Back
# How to Use Brushing to Investigate Outliers on a Graph
[Cody Steele](https://blog.minitab.com/en/blog/author/cody-steele) | 7/10/2014
Topics: [Statistics in the News](https://blog.minitab.com/en/blog/tag/statistics-in-the-news)
- [Share](https://www.linkedin.com/shareArticle?mini=true&url=https://blog.minitab.com/en/blog/statistics-and-quality-improvement/how-to-use-brushing-to-investigate-outliers-on-a-graph)
- [Share](https://www.facebook.com/sharer.php?u=https://blog.minitab.com/en/blog/statistics-and-quality-improvement/how-to-use-brushing-to-investigate-outliers-on-a-graph)
There’s a lot going on in the world, so you might not have noticed that the Organization for Economic Development (OECD) released their new set of health statistics for member nations. On the OECD website, you can now download the [free data series](http://www.oecd.org/els/health-systems/OECD-Health-Statistics-2014-Frequently-Requested-Data.xls) for 2014. (Be aware that “for 2014” means that the organization has a pretty good idea about what happened in 2012.)
Of course, there’s nothing more fun than sharpening your Minitab skills with real data. Each time the OECD releases their data, we hear about how much money is spent per person on health care compared to how long people live in that nation. (For example, [2013](http://www.businessinsider.com/oecd-report-life-expectancy-in-the-us-shorter-than-the-oecd-average-2013-11), 2012, and [2011](http://www.dailymail.co.uk/news/article-2065548/U-S-ranks-28th-life-expectancy-pay-MOST-health-care.html)) We also tend to be treated to graphics similar to the scatterplot below, typically with clever variations for the symbols:
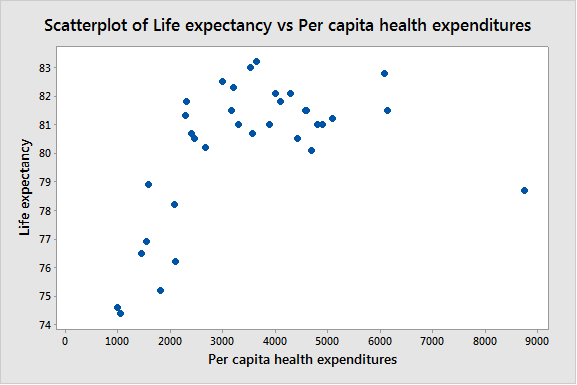
In this display, the point on the far right appears to be an outlier, spending more per capita than other nations but not fitting the general trend of increasing life expectancy as spending increases. When you see an apparent outlier, you want to investigate.
## Investigating Outliers with Brushing
Brushing is a feature in Minitab that makes it easy to investigate outliers in graphs. For example, from the scatterplot in Minitab, you can fit simple [regression](https://blog.minitab.com/blog/adventures-in-statistics/regression-analysis-tutorial-and-examples?hsLang=en) models with and without the suspected outlier to see how great the influence is on the model. You can copy and paste the data at the end of the post if you want to follow along.
Here’s how to do a visual sensitivity analysis of data on a scatterplot with brushing. Start by making the graph:
1. Choose **Graph > Scatterplot**.
2. From the gallery of scatterplots, select **Simple**. Click **OK.**
3. In **Y variables**, enter *‘Life Expectancy’*.
4. In **X variables**, enter *‘Per Capita Health Expenditures’*. Click **OK**.
Turn on brushing mode and set an ID variable to get specific information about the outlier. With the scatterplot window active, follow these steps:
1. Choose **Editor > Brush**.
2. Choose **Editor > Set ID Variables**.
3. In **Variables**, enter *Country 'Life expectancy' 'Per capita health expenditures'*. Click **OK**.
4. On the graph, click and drag to cover the unusual point.
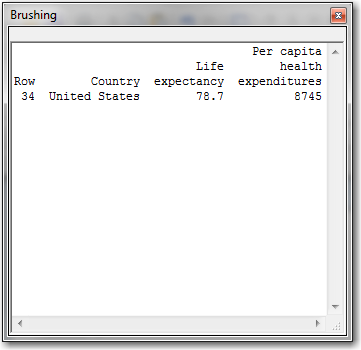
In the brushing window, you can see that the unusual point is the United States, row 34 in the data set. You can also see the specific values of life expectancy and per capita health expenditures.
To do the regression with and without the outlier, use brushing to create an indicator variable:
1. With the brushing window still showing, choose **Editor > Create Indicator Variable**.
2. In **Column**, enter *United States*.
3. Select **Update now**. Click **OK**.
4. Choose **Editor > Select**.
5. Choose **Editor > Select Item > Symbols**.
6. Choose **Editor > Edit Symbols**.
7. Select the **Groups** tab.
8. In **Categorical variables for grouping**, enter ‘*United States’*. Click **OK**.
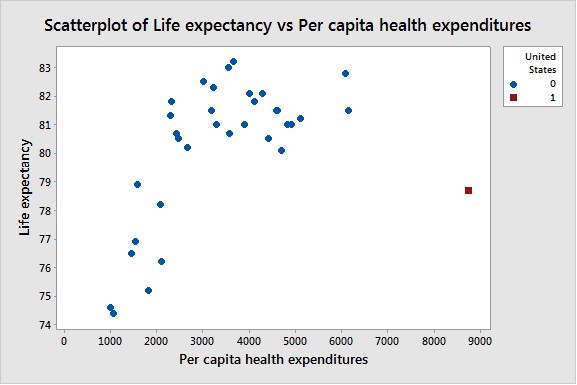
With groups on the graph, you can do separate regression fits for the groups.
1. Choose **Editor > Add > Regression Fit**.
2. Select **Quadratic**.
3. Check **Apply same groups of current displays to regression fit**. Click **OK**.
4. Choose **Editor > Add > Regression Fit**.
5. Select **Quadratic**. Click **OK**.
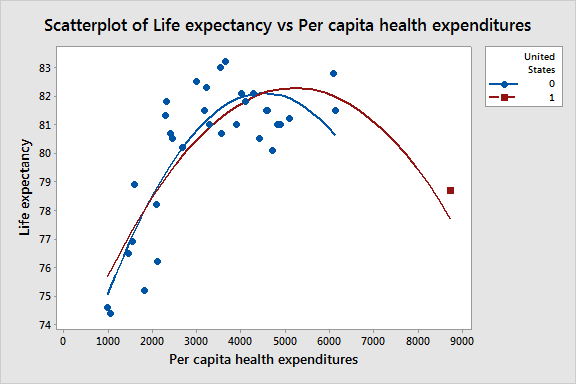
On the graph, the red curve shows that when you include the United States in the data, the decrease in life expectancy is slower than when you exclude the United States. Bonus tip: Hover over each curve in Minitab to see the regression equation used to create the curve.
## Using Brushing in Other Types of Graphs
Brushing is a great tool in Minitab for investigating specific points on a graph, but it doesn’t just work on scatterplots. If you’re ready for more, you can see [the complete list of graphs you can brush and how to make a graph that excludes brushed points](http://support.minitab.com/en-us/minitab/17/topic-library/basic-statistics-and-graphs/graph-options/exploring-data-and-revising-graphs/using-brushing-to-investigate-data-points/). Prefer an example? Check out how [Patrick Runkel](https://blog.minitab.com/blog/statistics-and-quality-data-analysis?hsLang=en) uses brushing to study the relationships on a [bubble plot](https://blog.minitab.com/blog/statistics-and-quality-data-analysis/opening-ceremonies-for-bubble-plots-and-poisson-regression?hsLang=en)!
Here’s the data for the per capita health care expenditures in United States dollars and the life expectancy for the total population at birth.
| Per Capita Health Expenditures | Life Expectancy | Country |
| --- | --- | --- |
| 3997 | 82.1 | Australia |
| 4896 | 81.0 | Austria |
| 4419 | 80.5 | Belgium |
| 4602 | 81.5 | Canada |
| 1577 | 78.9 | Chile |
| 2077 | 78.2 | Czech Republic |
| 4698 | 80.1 | Denmark |
| 1447 | 76.5 | Estonia |
| 3559 | 80.7 | Finland |
| 4288 | 82.1 | France |
| 4811 | 81.0 | Germany |
| 2409 | 80.7 | Greece |
| 1803 | 75.2 | Hungary |
| 3536 | 83.0 | Iceland |
| 3890 | 81.0 | Ireland |
| 2304 | 81.8 | Israel |
| 3209 | 82.3 | Italy |
| 3649 | 83.2 | Japan |
| 2291 | 81.3 | Korea |
| 4578 | 81.5 | Luxembourg |
| 1048 | 74.4 | Mexico |
| 5099 | 81.2 | Netherlands |
| 3172 | 81.5 | New Zealand |
| 6140 | 81.5 | Norway |
| 1540 | 76.9 | Poland |
| 2457 | 80.5 | Portugal |
| 2105 | 76.2 | Slovak Republic |
| 2667 | 80.2 | Slovenia |
| 2998 | 82.5 | Spain |
| 4106 | 81.8 | Sweden |
| 6080 | 82.8 | Switzerland |
| 984 | 74.6 | Turkey |
| 3289 | 81.0 | United Kingdom |
| 8745 | 78.7 | United States |
## You Might Also Like
[Better Together: Pairing Online and In-Person Learning is Key to Developing Critical Analytical Skills](https://blog.minitab.com/en/blog/better-together-pairing-online-and-in-person-learning-is-key-to-developing-critical-analytical-skills?hsLang=en)
[Data Analysis](https://blog.minitab.com/en/blog/tag/data-analysis) | 5 Minute Read
[Against the Odds: Honoring Women in Math and Statistics](https://blog.minitab.com/en/blog/honoring-women-in-math-and-statistics?hsLang=en)
[Statistics](https://blog.minitab.com/en/blog/tag/statistics) | 5 Minute Read
[Don't Stop 'Til You Get Enough: Demystifying CBD Oil Potency with Statistical Methodology](https://blog.minitab.com/en/blog/demystifying-cbd-oil-potency-with-statistical-methodology?hsLang=en)
[Food Manufacturing](https://blog.minitab.com/en/blog/tag/food-manufacturing) | 3 Minute Read
---
- [Careers](https://www.minitab.com/en-us/company/careers/)
- [Trust Center](https://www.minitab.com/en-us/trust-center/)
- [Suppliers](https://www.minitab.com/en-us/suppliers/)
- [Site Map](https://www.minitab.com/en-us/site-map/)
- [](https://www.linkedin.com/company/minitab/)
- [](https://www.facebook.com/Minitab/)
- [](https://www.youtube.com/user/MinitabInc)
- [](https://www.instagram.com/minitab/)
---
© 2025 Minitab, LLC. All Rights Reserved.
- [Terms of Use](https://www.minitab.com/en-us/legal/terms-of-use/)
- [Privacy Policy](https://www.minitab.com/en-us/legal/privacy-policy/)
- [Legal](https://www.minitab.com/en-us/legal/)
- Cookies Settings