


Capability statistics are wonderful things. These statistics tell you how well your process is meeting the specifications that you have. But there are so many capability statistics that it's worth taking some time to understand how they’re useful together.
Two capability statistics that are hard to keep straight are Cp and Cpk. Their names are different by only a single letter. A single letter that, by the way, doesn’t really explain anything about how these two statistics are different.
Definition of Cp
The equation for Cp is often written ET / NT. ET stands for Engineering Tolerance, which is the width between the specification limits. NT stands for Natural Tolerance, which is the width that should contain almost all of the data from the process. Traditionally, NT is 6 times the standard deviation.
We often describe Cp as the capability the process could achieve if the process was perfectly centered between the specification limits.
Definition of Cpk
The equation for Cpk is more complicated: [minimum(mean - LSL, USL - mean)] / (0.5*NT). LSL stands for Lower Specification Limit and USL stands for Upper Specification Limit.
Often we describe Cpk as the capability the process is achieving whether or not the mean is centered between the specification limits.
Cp and Cpk
The two statistics have a lot in common. The smaller the standard deviation, the greater both statistics are. In fact, under the right conditions, Cp and Cpk have exactly the same value.
Here's some data about the volume of ethanol in E85 fuel, which I've manipulated so that Cp and Cpk are the same. Minitab's capability analysis output shows both statistics together.
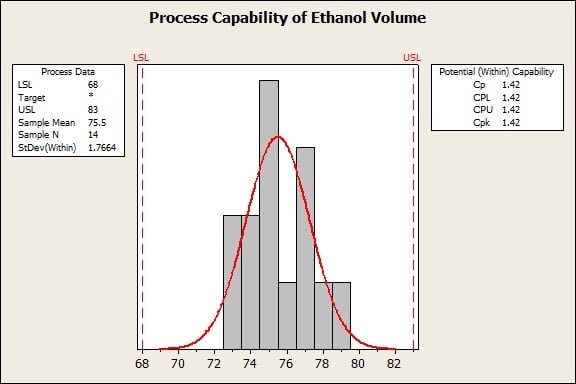
The specification limits here are 68 and 83, which are the limits that were in place for the volume of ethanol in E85 fuel in 2010. Halfway in between the specification limits is 75.5. The sample mean of this data is also 75.5 When the sample mean is halfway between the specification limits, Cp and Cpk are the same.
If the only goal is to have the greatest number of units inside of the specification limits, having the process centered between the specification limits is great. But for some products, other goals compete with having the greatest number of units inside of the specification limits. In the case of the volume of ethanol in E85 fuel, high ethanol content should reduce the use of non-renewable fuels and reduce certain emissions. Plus, most people who buy E85 fuel think that they're buying fuel with volumes of ethanol close to 85.
Here’s some real data collected in 2010 by the National Renewable Energy Laboratory on the ethanol volume in E85 fuel. (I’ve removed one outlier where the supplier minimized the volume of ethanol.)
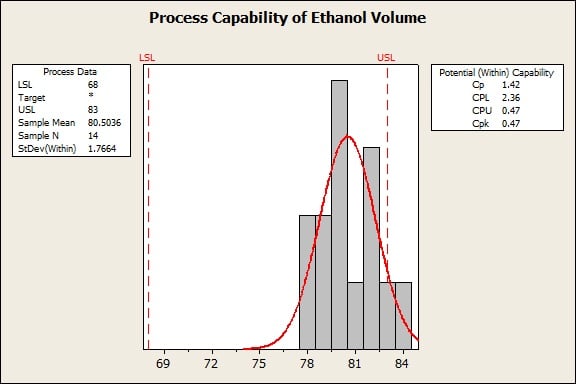
The sample mean is about 80.5. This mean is about 5 units higher than the midpoint of the specification limits. The further the sample mean is from the center of the specification limits, the lower Cpk becomes. Also, the further the mean moves away from the middle of the specification limits, the more different Cp and Cpk become.
So this is how Cp and Cpk work together: When the values are similar, the mean is close to the middle of the specification limits. When Cp is greater than Cpk, the mean is nearer to one specification limit or the other. Once you understand your process, you can make a good decision about how to prioritize your process improvement efforts.
Ready for More?
Now that you know how to use Cp and Cpk together, check out what it means when Ppk and Cpk are the same or different.