


by The Discrete Sharer, guest blogger
As Minitab users, many of us have found staged control charts to be an effective tool to quantify and demonstrate the “before and after” state of our process improvement activities.
However, have you ever considered using them to demonstrate the effects of changes to compensation/incentive plans for your employees?
Here's an example of how a mid-sized commercial bank used Minitab’s staged control charts to better inform senior leaders about the benefits of an pilot incentive plan program, in the hopes of having it implemented nationwide.
Background
Because most retail banking operations do not generate revenues or profits for the organization, there is a significant focus on reducing costs. For most organizations, this is most easily accomplished by offering starting salaries that are not much higher than minimum wage. While this may make sense initially, it does not properly account for the impact of high turnover in those jobs—and the associated costs of needing to frequently replace the people who work in those positions.
To address that, one organization designed an incentive compensation plan that “paid for itself,” and tested it at one of its processing sites over a period of 18 months. That test window included the baseline period followed by three iterations of the incentive plan, where the potential rewards increased from each previous level.
Production Environment and Incentive Plan Structures
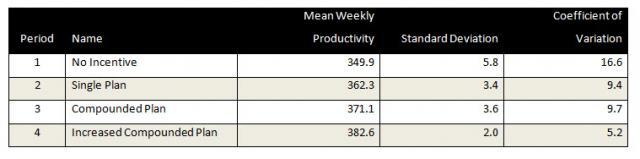
The incentive process had engineered standards that deemed “on-target performance” to be between 315 – 385 items per hour. This reflected a +/- 10% range to the mean of 350 items per hour. For the initial 20 weeks of the pilot, the baseline weekly productivity mean was 349.90 items per hour, with a standard deviation of 5.8.
As had been the common business practice for many years, no additional incentive or compensation rewards were offered to employees for the first 20 weeks of the pilot program. For the subsequent three 20-week periods, increasing incentive awards were developed and implemented. They were structured as follows:
Single Plan:
Any employee who showed a 5% or greater improvement to the initial 20-week period received a $25 gift card each month. This award also included a “tax gross-up” so that the employee would get the full value of the award without incurring a tax penalty.
Compounded Plan:
About half of the employees showed some slight degradation in their work quality. To combat this unintended consequence, employees could earn additional rewards in the second phase by maintaining their gain (if they had met the initial 5% goal) or improving to that threshold while keeping their quality levels at the same rate or better. For those who met these objectives, the gift card amount was increased to $50 per month.
Increased Compounded Plan:
This was similar to the Compounded Plan, except for the amount of the gift card increased to $100 per month.
Assessing the Impact of the Incentive Plan
By offering employees a way to “earn more by doing more” through the incentive plan, the site saw improved performance that exceeded initial estimates. The table below provides some basic data on the results of each stage.
Shown graphically on a staged control chart created in Minitab Statistical Software, the results looked like this:
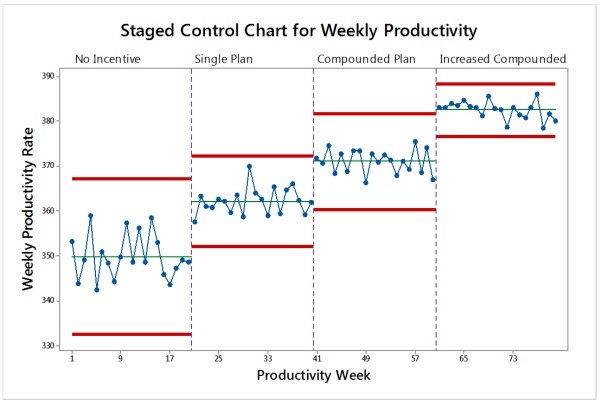
Using the Staged Control Chart to Influence Management
Despite the fact that the incentive plan paid for itself through increased employee productivity, the business line manager was reluctant to embrace the results.
That is, until she was shown the Staged Control Chart seen above.
The manager's newfound support for the program was due to the visual impact of seeing variation reduced over the life of the pilot. She hadn't been educated as an engineer, but she did understand the importance of reducing variation within a process.
For her, knowing that the process was seeing reduced variation meant that the unit could do a better job predicting the labor needs for the upcoming quarters.
About the Guest Blogger
The Discrete Sharer's identity and biographical information is confidential.