


People frequently have different opinions. Usually that's fine—if everybody thought the same way, life would be pretty boring—but many business decisions are based on opinion. And when different people in an organization reach different conclusions about the same business situation, problems follow.
Inconsistency and poor quality result when people being asked to make yes / no, pass / fail, and similar decisions don't share the same opinions, or base their decisions on divergent standards. Consider the following examples.Manufacturing: Is this part acceptable?
Billing and Purchasing: Are we paying or charging an appropriate amount for this project?
Lending: Does this person qualify for a new credit line?
Supervising: Is this employee's performance satisfactory or unsatisfactory?
Teaching: Are essays being graded consistently by teaching assistants?
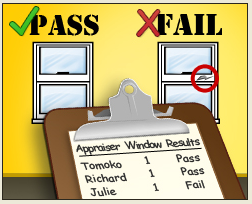
It's easy to see how differences in judgment can have serious impacts. I wrote about a situation encountered by the recreational equipment manufacturer Burley. Pass/fail decisions of inspectors at a manufacturing facility in China began to conflict with those of inspectors at Burley's U.S. headquarters. To make sure no products reached the market unless the company's strict quality standards were met, Burley acted quickly to ensure that inspectors at both facilities were making consistent decisions about quality evaluations.
Sometimes We Can't Just Agree to Disagree
The challenge is that people can have honest differences of opinion about, well, nearly everything—including different aspects of quality. So how do you get people to make business decisions based on a common viewpoint, or standard?
Fortunately, there's a statistical tool that can help businesses and other organizations figure out how, where, and why people evaluate the same thing in different ways. From there, problematic inconsistencies can be minimized. Also, inspectors and others who need to make tough judgment calls can be confident they are basing their decisions on a clearly defined, agreed-upon set of standards.
That statistical tool is called "Attribute Agreement Analysis," and using it is easier than you might think—especially with data analysis software such as Minitab.
What Does "Attribute Agreement Analysis" Mean?
Statistical terms can be confusing, but "attribute agreement analysis" is exactly what it sounds like: a tool that helps you gather and analyze data about how much agreement individuals have on a given attribute.
So, what is an attribute? Basically, any characteristic that entails a judgment call, or requires us to classify items as this or that. We can't measure an attribute with an objective scale like a ruler or thermometer. The following statements concern such attributes:
- This soup is spicy.
- The bill for that repair is low.
- That dress is red.
- The carpet is rough.
- That part is acceptable.
- This candidate is unqualified.
Attribute agreement analysis uses data to understand how different people assess a particular item's attribute, how consistently the same person assesses the same item on multiple occasions, and compares both to the "right" assessment.
This method can be applied to any situation where people need to appraise or rate things. In a typical quality improvement scenario, you might take a number of manufactured parts and ask multiple inspectors to assess each part more than once. The parts being inspected should include a roughly equal mix of good and bad items, which have been identified by an expert such as a senior inspector or supervisor.
In my next post, we'll look at an example from the financial industry to see how a loan department used this statistical method to make sure that applications for loans were accepted or rejected appropriately and consistently.