


**Post Updated on 4/29/24**
In technical support, we frequently receive calls from Minitab users who have questions about the differences between Cpk and Ppk.
We have written about the differences between Cpk and Ppk, but it also helps to have a better understanding of the math behind these numbers. So in this post I will show you how to calculate Ppk using Minitab’s default settings when the subgroup size is greater than 1. Then, in my next post, I’ll show you how to calculate Cpk.
Default Capability Methods
For data that follow the normal distribution, we use a Normal Capability Analysis (Stat > Quality Tools > Capability Analysis > Normal). If we click the Estimate button in the dialog box that comes up, we can see the default methods used in Minitab:
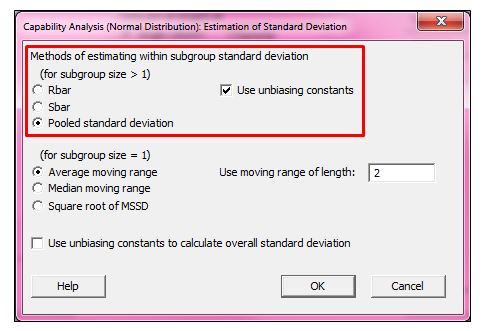
From the dialog box above, we can see that Minitab uses the Pooled standard deviation when subgroup sizes are greater than 1.
Calculating the Mean and Overall Standard Deviation
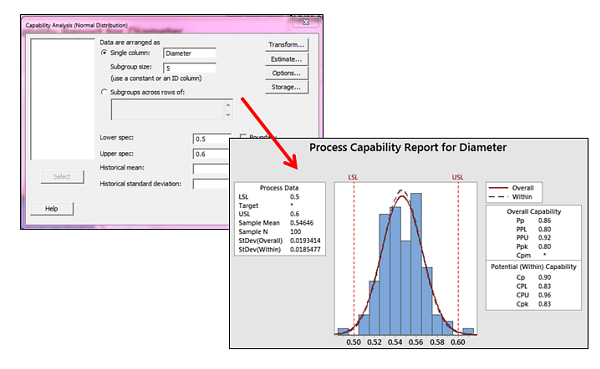
This sample data set is from a manufacturer of cable wire; the data was collected in subgroups of 5, then the diameters of the cables were recorded and entered in the Minitab worksheet. The lower spec limit for the cable diameter is 0.5 and the upper spec limit is 0.6.
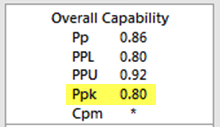
If we use the information above to complete the Capability dialog box as shown below (accepting the default settings for the within-subgroup estimation method), Minitab gives us estimates of Cpk and Ppk:
But how exactly does Minitab arrive at these numbers? That's what we're going to find out.
Calculating Ppk is easier than Cpk, since Ppk is based on the overall standard deviation of the data instead of the within-subgroup standard deviation. We'll see the formula for that in my next post, but to obtain the overall standard deviation we can use Stat > Basic Statistics > Store Descriptive Statistics and store the standard deviation and the mean (which we’ll also need) in the worksheet:
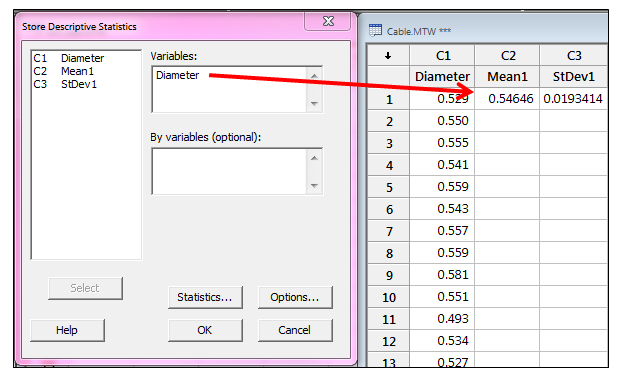
(Be sure to click the Statistics button in the dialog box above to make sure only Mean and Standard Deviation are selected before clicking OK.)
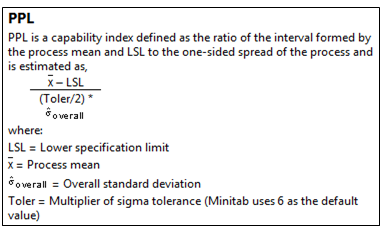
Calculating Ppk
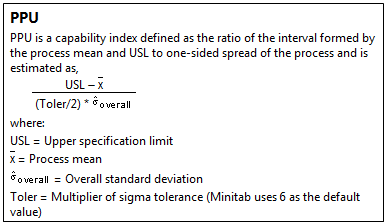
To get Ppk (which is the lesser of PPU and PPL), we need to calculate PPU and PPL using the standard deviation and mean shown above, following the formulas shown in Methods and Formulas:
In Minitab, we use Calc > Calculator to enter the formulas and store them in the worksheet:
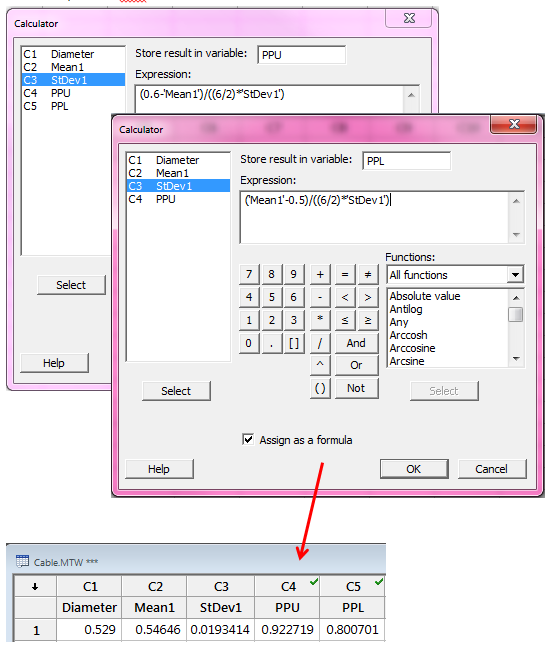
The formulas above give us a PPU of 0.922719 and PPL of 0.800701. Since Ppk is the lesser of these two values, the Ppk is 0.80.
You'll note that this matches the results from the Minitab capability analysis output shown earlier:
Of course, it's easier to use Minitab's capability output than it is to do these calculations manually, but my goal is to lift the lid off the "black box" and give you an appreciation for what Minitab does behind the scenes to provide these figures. In my next post, we'll see how Cpk is calculated.