


Over the last year or so I’ve heard a lot of people asking, “How can I calculate B10 life in Minitab?” Despite being a statistician and industrial engineer (mind you, one who has never been in the field like the customers asking this question) and having taken a reliability engineering course, I’d never heard of B10 life. So I did some research.
The B10 life metric originated in the ball and roller bearing industry, but has become a metric used across a variety of industries today. It’s particularly useful in establishing warranty periods for a product. The “BX” or “Bearing Life” nomenclature, which refers to the time at which X% of items in a population will fail, speaks to these roots.
So then, B10 life is the time at which 10% of units in a population will fail. Alternatively, you can think of it as the 90% reliability of a population at a specific point in its lifetime—or the point in time when an item has a 90% probability of survival. The B10 life metric became popular among ball and roller bearing makers due to the industry’s strict requirement that no more than 10% of bearings in a given batch fail by a specific time due to fatigue failure.
Now that I know what the term means, I can tell people who ask that Minitab’s reliability analysis can easily compute this metric. (In fact, our statistical software can compute any “BX” lifetime—but we’ll save that for another blog post.) B10 life is also known as the 10th percentile and can be found in Minitab’s Table of Percentiles output, which is displayed in Minitab’s session window.
And unlike other reliability metrics, B10 life directly correlates the maximum allowable percentile of failures (or the minimum allowable reliability) with an application-specific life point in time.
So we can get the B10 life metric by looking at the Table of Percentiles in Minitab’s session window output. But you might still be asking two questions: how do I create this table, and how do I interpret it?
 Finding B10 Life, Step by Step
Suppose we have tracked and recorded the battery life times over a certain number of years for 1,970 pacemakers. The reliability of pacemakers is critical, because patients’ lives depend on these devices!
We observed exact failure times—defined as the time at which a low battery signal was detected—for 1,019 of those pacemakers. The remaining 951 pacemakers never warned of a low battery, so they “survived.”
Our data is organized as follows:
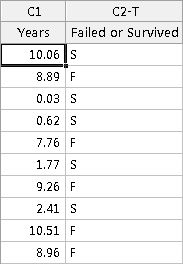
When we have both observed failures and units surviving beyond a given time, we call the data “right-censored.” And we know from process knowledge that the Weibull distribution best describes the lifetime of these pacemaker batteries. Knowing this information will help us use Minitab’s reliability analysis correctly.
Setting Up the Reliability Analysis
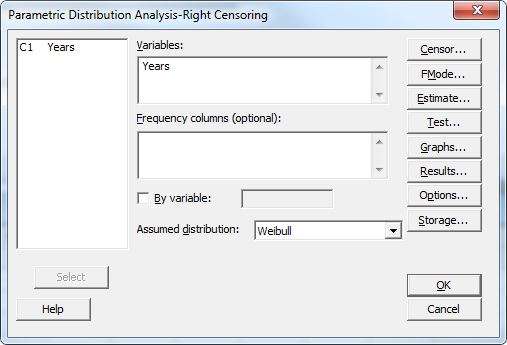
Because we have right-censored data and we know our distribution, we are ready to access Minitab’s Statistics > Reliability/Survival > Distribution Analysis (Right Censoring) > Parametric Distribution Analysis menu to compute the B10 life.
We want to know the batteries’ reliability—or probability of survival—at different times, so our variable of interest is the number of years a pacemaker battery has survived. In the Parametric Distribution Analysis dialog, you’ll notice the Weibull distribution is already selected as the assumed distribution. We’ll leave this default setting since we know the Weibull distribution best describes battery life times.
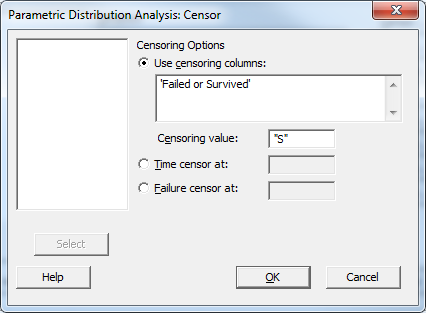
We also know whether the number in the ‘Years’ column was an exact failure time or a censored time (beyond which the battery survived). We must account for the censored data. By clicking the button labeled ‘Censor’, we can include a censoring column that contains values indicating whether or not the pacemaker survived or failed at the recorded time. In our Minitab worksheet, “Failed or Survived” is the censoring column. Our censoring value is ‘S’, which stands for ‘Survived’, indicating no failure was observed during the pacemaker battery tracking period.
Interpreting the Table of Percentiles and B10 Life
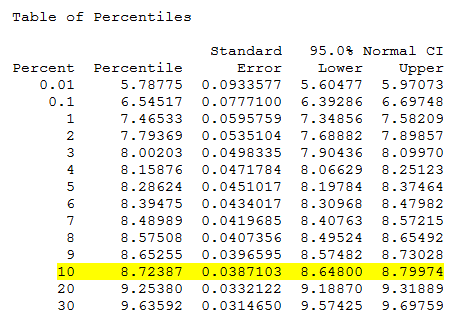
Once we click OK through all dialogs to carry out the analysis, Minitab outputs the Table of Percentiles, where we can find our B10 life:
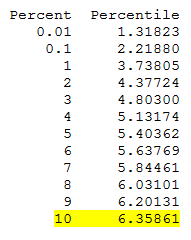
Where the Percent column displays 10, the corresponding Percentile value tells us that the B10 life of pacemaker batteries is 6.36 years—or, to put it another way, 6.36 years is the time at which 10% of the population of pacemaker batteries will fail.
There we have it! The next time you are looking to compute the B10 life of a product, and perhaps seeking to establish suitable warranty periods, you need look no further than Minitab’s reliability tools and the Table of Percentiles.
Case study:
Time-to-Market and Design for Reliability at the Speed of Light in Signify
Get ready for a light bulb moment! In a fast-changing industry where time-to-market and product reliability give a competitive edge, discover how the world’s leading lighting company Signify, rapidly validates new innovations. In this one hour webinar, Prof W.D. van Driel and Dr P. Watté will shed a light on design for reliability (DfR) using Minitab Statistical Software at Signify, the former Philips Lighting. Learn from real-life examples their methods to lower your development costs, improve your designs’ performance and compliance, and accelerate the testing of product design reliability. If you develop products intended to meet high specifications for years to come, you will discover how to reduce the risks and consequences of product failure and costly claims - for you and your customers.

![[Webinar Replay] Time-to-Market and Design for Reliability at the Speed of Light at Signify](https://no-cache.hubspot.com/cta/default/3447555/b70a5a3e-03b6-408b-bbc1-7851ef13e4e9.png)