


Over on the Indium Corporation's blog, Dr. Ron Lasky has been sharing some interesting ideas about using the Weibull distribution in electronics manufacturing. For instance, check out this discussion of how dramatically an early first-failure can affect an analysis of a part or component (in this case, an alloy used to solder components to a circuit board).
This got me thinking again about all the different situations in which the Weibull distribution can help us make good decisions. The main reason Weibull is so useful is that it's very flexible in fitting different types of data, because it can take on the characteristics of other types of distributions. For example, if you have skewed data, the Weibull is an alternative to the normal distribution.
Developing a Demonstration Test Plan with the Weibull Distribution
In business and industry, the Weibull distribution is frequently used to model time-to-failure data. In other words, it can help us assess the reliability of component or part by estimating how long it will take to fail. If you work for the company supplying those parts, it can help you check the quality of the components you're making, and to prove to your customers that your products meet their requirements.
A good way to do this is to follow a Demonstration Test Plan, and Minitab Statistical Software can help you create test plans using the Weibull distribution (or some other distribution, if you know it's more appropriate). Minitab's test planning commands make it easy to to determine the sample size and testing time required to show that you have met reliability specifications.
Your test plan will include:
- The number of units or parts you need to test
- The stopping point, which is either the amount of time you test must each part or the number of failures that must occur
- The measure of success, which is the number of failures allowed in a passing test (for example, every unit runs for the specified amount of time and there are no failures)
You can use Minitab to create demonstration, estimation, and accelerated life test plans, but let's focus on demonstration test plans here.
What Types of Demonstration Test Plans Are There?
There are two types of demonstration tests:
Substantiation Tests
A substantiation test provides statistical evidence that a redesigned system has suppressed or significantly reduced a known cause of failure. This test aims to show that the redesigned system is better than the old system.
Reliability Tests
A reliability test provides statistical evidence that a reliability specification has been achieved. This test aims to show that the system's reliability exceeds a goal value.
You can tweak these tests depending on scale (Weibull or exponential distribution) or location (other distributions), a percentile, the reliability at a particular time, or the mean time to failure (MTTF). For example, you can test whether or not the MTTF for a redesigned system is greater than the MTTF for the old system.
An Example of a Demonstration Test Plan
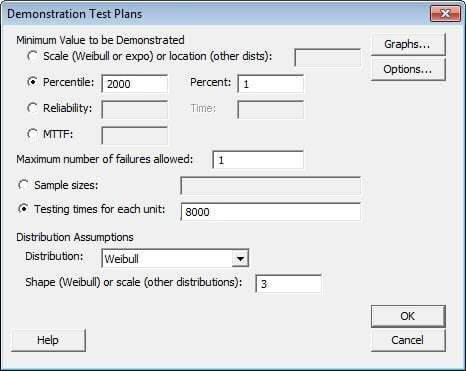
Let's say we work for a company that makes turbine engines. The reliability goal for a new turbine engine combustor is a 1 percentile of at least 2000 cycles. We know that the number of cycles to failure tends to follow a Weibull distribution with shape = 3, and that we can accumulate up to 8000 test cycles on each combustor. We need to determine the number of combustors it takes to demonstrate the reliability goal using a 1-failure test plan.
Here's how to do it in Minitab (if you're not already using it, download the free 30-day trial of Minitab and play along):
- Choose Stat > Reliability/Survival > Test Plans > Demonstration
- Choose Percentile, then enter 2000. In Percent, enter 1.
- In Maximum number of failures allowed, enter 1.
- Choose Testing times for each unit, then enter 8000.
- From Distribution, choose Weibull. In Shape (Weibull) or scale (other dists), enter 3. Click OK.
Your completed dialog box should look like this:
Interpreting the Demonstration Test Plan Results
When you click OK, Minitab will create the following output:
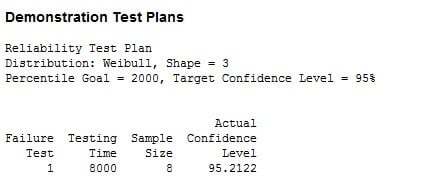
Looking at the Sample Size column in the output above, we can see we'll need to test 8 combustors for 8000 cycles to demonstrate with 95.2% confidence that the first percentile is at least 2000 cycles.
When it generates your Demonstration Test Plan, Minitab also creates this graph:
The graph gives us a visual representation of the likelihood of actually passing the demonstration test. Here,
- The very sharp rise between 0 and 2 indicates that the probability of your 1-failure test passing increases steadily as the improvement ratio increases from zero to two.
- If the improvement ratio is greater than about two, the test has an almost certain chance of passing.
Based on this information, if the (unknown) true first percentile was 4000, then the improvement ratio = 4000/2000 = 2, and the probability of passing the test will be about 0.88. If you reduced the value to be demonstrated to 1600, then the improvement ratio increases to 2.5 and the probability of passing the test increases to around 0.96. Reducing the value to be demonstrated increases the probability of passing the test. However, it also makes a less powerful statement about the reliability of the turbine engine combustor.
What's the Right Demonstration Test Plan?
The right demonstration test for your situation will depend on many factors. Fortunately, it's easy to adjust different parts of a proposed test to see how they affect the task. Each combination of maximum number of failures allowed and sample size or testing time will result in one test plan, so you can use Minitab to generate several test plans and compare the results.
Case study:
Time-to-Market and Design for Reliability at the Speed of Light in Signify
Get ready for a light bulb moment! In a fast-changing industry where time-to-market and product reliability give a competitive edge, discover how the world’s leading lighting company Signify, rapidly validates new innovations. In this one hour webinar, Prof W.D. van Driel and Dr P. Watté will shed a light on design for reliability (DfR) using Minitab Statistical Software at Signify, the former Philips Lighting. Learn from real-life examples their methods to lower your development costs, improve your designs’ performance and compliance, and accelerate the testing of product design reliability. If you develop products intended to meet high specifications for years to come, you will discover how to reduce the risks and consequences of product failure and costly claims - for you and your customers.

![[Webinar Replay] Time-to-Market and Design for Reliability at the Speed of Light at Signify](https://no-cache.hubspot.com/cta/default/3447555/b70a5a3e-03b6-408b-bbc1-7851ef13e4e9.png)