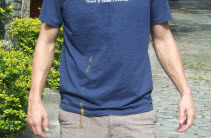
On a recent vacation, I was unsuccessfully trying to reunite with my family outside a busy shopping mall and starting to get a little stressed. I was on a crowded sidewalk, in a busy city known for crime, and it was raining. I thought there was no way things could get more aggravating when something warm and solid hit my arm and shirt.
A bird had pooped on me.
Not having the kids with me, and being in a foreign country, I used a couple of words in English that best represented my feelings towards the bird and the entire situation. Being a generally positive person, I had quickly recovered once I had gotten dry, cleaned up, and had the kind of beverage you have when you've been defecated on and want to de-stress. I told the kids, who of course found it funny. I even laughed a little.
What are the odds?
Two days later, in a small beach town, my wife and I were returning from a hike. I was not even thinking about the poop incident any longer when something warm and solid hit my shirt and shorts.
A bird had pooped on me. Again.
Now, based on quantity and viscosity, we have some reason to believe it may have actually been the small monkeys common that part of the world, but that's beside the point of this post. And at this point, you may be wondering what the point of this post is actually since all I've done thus far is given you two reasons to laugh at my misfortune...
The Poisson Process
Events that occur completely randomly and with roughly equal probability over time—like a bird pooping on you, or a server crashing, or workplace injuries in a factory—come from what is known as a Poisson process.
You may know Poisson as being related to count data, and the application here is that if you take random spans of time of equal length (days, months, years, etc.), the number of occurrences of the event in each span will follow the Poisson distribution. The time between those events follows the exponential distribution, meaning that most events will happen somewhat close together but there will also be really long spans between events sometimes.
Many undesirable events in healthcare settings—like hospital-acquired infections, falls, accidental needle sticks—follow this model. They can be tracked using a T-Chart (or if only the count of days or hours are known, the G-Chart) in Minitab so a practitioner can know if these events have started occurring more or less frequently.
This model is also useful in making me feel better, since I know that while getting pooped on by a bird is a pretty rare and unpredictable event, having it happen twice in three days isn't as crazy as it first sounds.


