The healthcare industry has faced enormous challenges in 2020, namely battling the novel coronavirus COVID-19. This industry is made of professionals known for their resiliency, empathy, long hours of hard work and optimism. Given all they do to help others, healthcare workers especially deserve help making their jobs and saving lives easier. One small way Minitab can specifically help them is with value stream mapping.

What is a Value Stream Map?
A value stream map (VSM) is a tool that helps to visualize every step or action required to complete a process from start to finish.
Originally created as a lean manufacturing technique, the goal of a VSM is to help the user not only visualize, but map and understand the flow of materials and information. These insights can then be used to identify improvements to optimize the process, like reducing waste or increasing speed.
When looking specifically at the healthcare industry, there are plenty of data-rich opportunities that could use the help of value stream mapping. Some examples include improving HCAHPS (Hospital Consumer Assessment of Healthcare Providers and Systems) Scores, decreasing patient wait times, increasing capacity/throughput and overall inventory optimization for items like N95 respirator masks, hand sanitizer or IV bags.
Can Value Stream Mapping (VSM) Actually Help in Healthcare?
Absolutely! One application for VSM in healthcare is mapping a patient’s path to treatment, then utilizing it to improve service and minimize delays.
One thing to note when trying to accurately map a process or system is that obtaining high-quality, reliable data about the flow of information and the time a patient spends at or between steps is key. Precisely timing process steps and leveraging communication between cross-functional teams is essential to obtain a true picture of what’s going on.
To begin mapping a patient’s path to treatment, a current state map would need to be created to act as a baseline for identifying areas of improvement. One of the easiest ways to create a value stream map is using either Minitab Workspace or Minitab Engage. (Not sure which is right for you? Talk to Minitab)
Follow along and make your own value stream map:

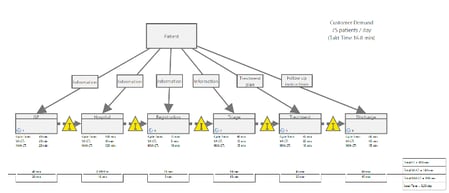
In this example, the first step a patient takes is to visit their general physician (abbreviated as “GP” below). This step is represented as a rectangular process shape in the value stream map. The total time the patient spends at this step is called the cycle time and is broken down underneath the rectangle into value-added (“VA”) and non value-added (“NVA”). VA is time the customer is willing to pay for, i.e., the 20 minutes spent consulting with the GP, while NVA is the time the customer is not willing to pay for, i.e., the time spent in the waiting room before the appointment.

After figuring out the cycle time, you see a dotted line arrow between process steps called a push arrow. This shows that once a patient completes a step, they are “pushed” or advanced to the next step. Lean experts generally suggest a more efficient process could be designed by changing those push steps to continuous flow or "pull" steps instead. The yellow triangles above the dotted line arrow indicates the time a patient spends waiting for the next process. These steps are a non-value added action for the patient.
By identifying all of the steps, you can start to map the whole process out, moving from left to right. While VSM can certainly be done on paper, using powerful, visual business tools like those in Minitab Workspace or Minitab Engage can make the process a lot easier. For example, both Minitab Workspace and Minitab Engage automatically calculate and display a timeline underneath the VSM, which adds up the total time to go through the entire system (aka “lead time”) including overall summary information.
Once the entire system has been mapped out, an ideal future state map can be created, and possibly a series of future states in between. These can identify areas for improvement, and once implemented, they can become the “new” current state map as part of an iterative quality improvement process.
How Do You Improve the Current State Map or Process?
When looking for areas of improvement, try to focus on changes to improve the flow of patients through the process. Continuous flow is the ideal and moves patients through the system without them having to wait. However, continuous flow is not always possible, so instead other changes might be introduced—such as first-in, first-out (FIFO).
Another idea would be to take a look at the takt time, which can help you decipher the pace of demand. In this case, takt time can be interpreted as the number of patients that can be treated per unit of time. Both Minitab Workspace and Minitab Engage will calculate takt time automatically.
Once you have completed the current and future state maps, you can compare the two, quantify improvement opportunities and look at how to implement the changes. In this example, the triage and sort/appointment steps might be combined so that fewer visits to the hospital were required by the patient and they receive treatment faster.
To learn more about value stream mapping or visualizing healthcare processes, check out our other blog posts:
- Combating COVID-19: How Adventist HealthCare is Using Process Maps to Fight Back and Keep Staff Safe
- Five Guidelines You Need to Follow to Create an Effective Value Stream Map
- Four More Tips for Making the Most of Value Stream Maps
Ready to create a value stream map for your healthcare system?


