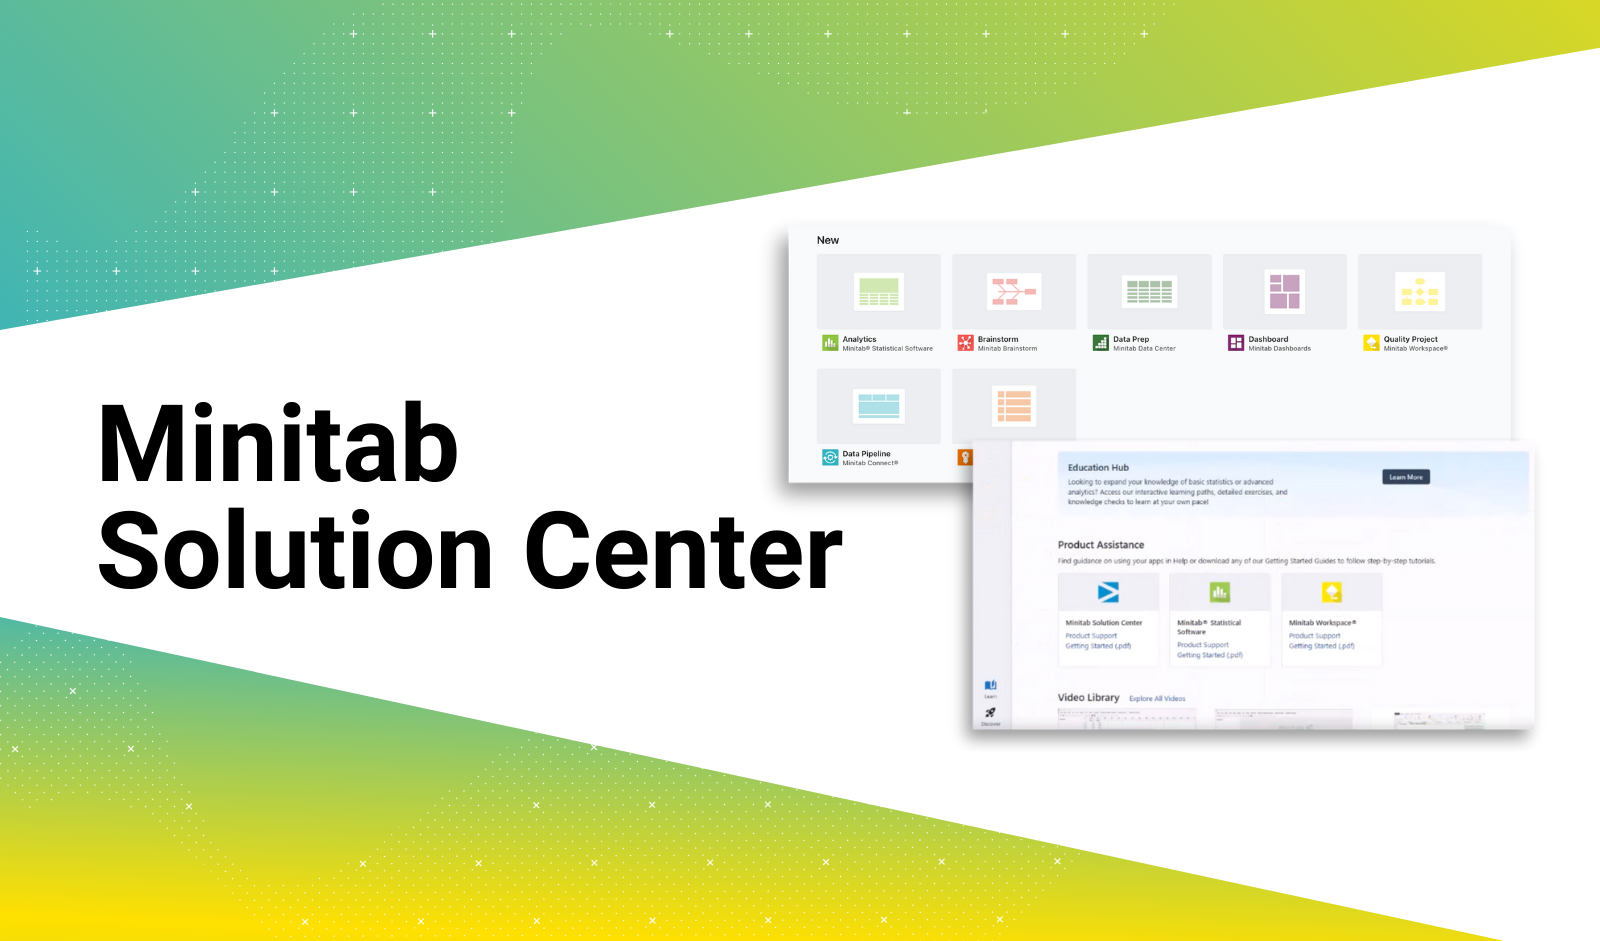
The Minitab Solution Center: Bridging Data and Decision-Making
The Minitab Solution Center offers integrated, user-friendly tools for complex data analysis and visualization, empowering users to make confident, data-driven decisions. It provides a holistic approach to data analysis, project management, and informed decision-making. Experience seamless data preparation, brainstorming, and intuitive visualizations to enhance your business capabilities. Try it now with a free trial!
4 Ways to Measure Improvement Using Before/After Control Charts with Stages
Learn the 4 main ways you can use Minitab Statistical Software to measure process improvements with Before/ After Charts with Stages.
3 Steps to Prevent Backorders and Optimize Your Inventory Levels
Learn the three steps to prevent backorder and optimize your inventory levels using Minitab solutions like Workspace, Connect and predictive analytics.
Beyond Ordinary Business Intelligence Dashboards
Minitab is the only company to leverage the advanced analytics, including statistics, to power BI dashboards today.
Why Chemical Engineers Should Get to Know ANOVA
Learn how chemical engineers can use Analysis of Variance (ANOVA) to compare the means of measurements across groups.
Analyzing Bitcoin Data Using the Minitab Predictive Analytics Module
Minitab Senior Advisory Data Scientist, Mikhail Golovnya, demonstrates how to use Minitab Predictive Analytics Module to identify Bitcoin trends.
An Innovation Management Case Study from the Minitab Organization
When the Minitab sought innovative ways to leverage Minitab Engage tools, it turned to employees for ideas that ultimately led to a new product offering.
Six Data Preparation Tasks You Thought Only Programmers Could Handle
Learn about data preparation tasks you can do yourself using Minitab Connect's "coding optional" data prep tools
Five Hot Ways to Use Heatmap Visualizations
Heatmaps have been added to the latest version of Minitab Statistical Software! How much do you know about them and their use?
Updating Graphs, Making Patterned Data and More Tips & Tricks to Help You Master Minitab
Quick tips to manipulate data, run analyses and create visualizations faster. Plus watch them in action in the Tips & Tricks for Minitab webinar on demand.


