


Muntasir Mamun and Mohammad Ujjal are riding across the U.S. on a bicycle built for two.
As they pedal in sync from Seattle to New York, they're not only gazing at our purple mountains’ majesty and amber waves of grain. They’re also keeping their eyes peeled for plastic soda bottles, glass beer bottles, and styrofoam cups!
These self-dubbed “trashmaniacs” are collecting and recording every piece of trash they find on their 5000-mile trip. Their mission? To make us more aware of how the waste that we generate here can have a profound impact in places very far away.
I love what these guys are doing—and the offbeat, creative way they’re doing it. So I’ve been thinking of how to use Minitab to help them spread their message.
Using a Pareto Chart to Track Litter
Muntasir and Mohammed are from Bangladesh, which has a dense population living in the delta region near the seacoast. At those low elevations, even a slight rise in sea levels due to climate change would be devastating for millions of its people.
So their message is simple: let's be more efficient and not waste what we produce. By reusing materials and consuming more thoughtfully, we can reduce the energy and environmental costs associated with overproducing products that are too quickly discarded as waste.
“In Bangladesh no plastic bag or bottle is ever wasted. But a few wasted plastic bottles thousands of miles away is still bad news to a place that is among the most vulnerable in the world," they write.
After more than a month on the road, Muntasir and Muhammed just crossed the Iowa-Illinois border. This Minitab Pareto chart (Stat > Quality Tools > Pareto Chart) shows the most common types of trash they've collected:
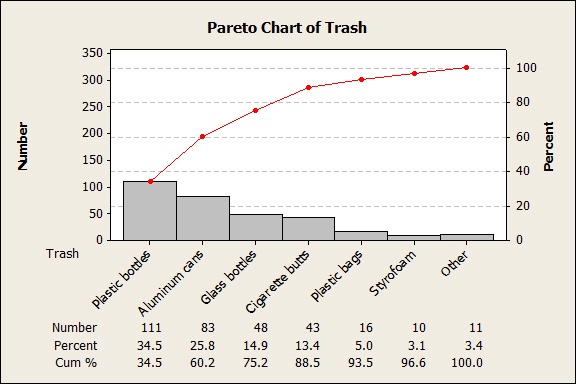
So far, the "vital few" roadside defects are mainly discarded beverage containers--plastic bottles, aluminum cans, and glass bottles.
Using Time Series Plots to Track Waste Disposal
Are we making any progress in recycling and waste disposal over the last 50 years?
To find out, I obtained historical data on municipal waste from the U.S. Environmental Protection Agency and used it to create time series plots in Minitab with multiple variables (Graph > Time Series Plot > Multiple).
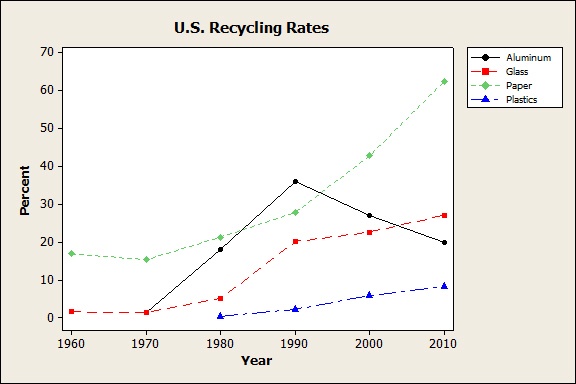
The plot shows that we've made great progress in recycling paper. Unfortunately, after a promising start, our rate of recycling aluminum has dropped over the last two decades.
Recycling rates for plastic and glass show an upward trend—and that’s good news. But we still recycle only about 25% of the glass and 8% of the plastic that we generate.
Are our rates of recycling increasing fast enough? The plot below shows the millions of tons of municipal waste that are still left over after recycling.
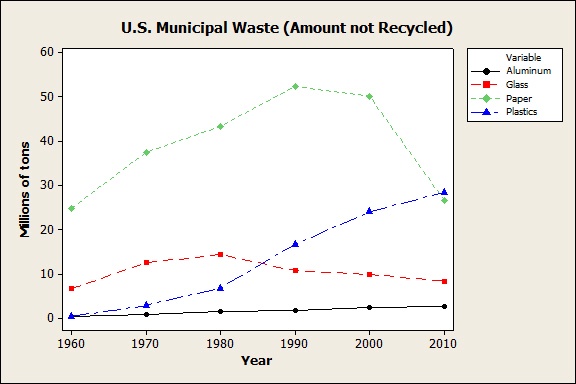
On the positive side, the amount of discarded paper in the U.S. has dropped dramatically—almost 30 million tons in the last decade alone. So we really can change our ways! Hopefully, this trend is quadratic (an inverted U) and will drop even more by 2020.
On the negative side, the plot corroborates what the trashmaniacs are finding on the road: Too much plastic waste.
Unless we change our behavior, discarded plastics could continue to follow the steadily increasing linear trend shown on the plot and reach over 30 million tons annually by 2020.
A Pie Chart of Discarded Plastics
Now that Minitab has helped to identify plastic as a major contributor to unrecycled waste, let's use it to see what types of plastic make up the 28 millions tons we discarded in 2010.
(Choose Graph > Pie Chart. Click Labels and adjust options to display the labels on the outside of the pie.)
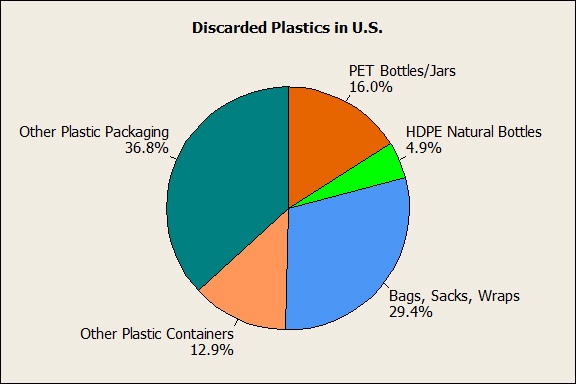
The chart shows that plastic bags, sacks, wraps, and other plastic packaging make up more than 60% of our plastic waste. About 16% (2 million tons) of the plastic that we discard annually contains polyethylene terephthalate (PET), a thermoplastic polymer used in soft drink bottles and plastic jars. (I'll let you Google that and draw your own conclusions.)
Simple Visuals = Powerful Messages = Real Change
Sometimes, you don't need a lot of complex calculations to get a point across. These simple Minitab graphs—and the honest, direct message of the trashmaniacs—have convinced me that I need to make more of an effort. So here's a couple of things I'm going to start doing from now on.
- Avoid using plastic grocery bags.
A couple years ago, Minitab gave each employee an eco-friendly reusable grocery bag. It's still in my car—but I haven't used it once, sad to say. No excuses anymore! - Choose products with minimal packaging.
I'm going to make a conscious and deliberate effort to purchase items at the store that are not mummy-wrapped in wasteful packaging.
Skeptics might say that my small changes won't make much of a dent in the millions of tons of plastic that we discard each year. But as Muntasir and Mohammad show us, as individuals we really can make a difference.
We just all need to get on a bike together—one built for about 9 billion people.

Followup: Hop on the Bike!
Are you looking for ways to reduce waste? At home or in your company?
Find out how Building Innovations, a division of Dupont that helps builders create more efficient and sustainable structures, recently used Minitab to track their progress in eliminating all landfill waste from its 15 facilities worldwide, slashing landfill waste from 81 million pounds to 0 pounds in 3 years.
Source: Municipal Solid Waste Generation, Recycling, and Disposal in the United States. U.S. Environmental Protection Agency. Office of Resource Conservation and Recovery. December 2011.
Credits: Thanks to Gunnar for tipping me off about the Trashmaniacs and suggesting this post!