


Watching the news in the U.K. is like listening to the same old annoying record over and over again: "Uncertainties about the European economy...disappointing employment figures...stubbornly high inflation...increasing pressures on the average U.K. household to make ends meet…"
How about some good news, please?
Actually, there is some good news…that is, if you are a top executive for one of the FTSE 100 companies. According to the pay research company Incomes Data Services (IDS), the median remuneration for the directors of the U.K.'s top businesses rose 50% over the past year, which took the average pay for a director of a FTSE 100 company to just short of £2.7m!
Hang on, reading what I just wrote back to myself, I am getting slightly confused here…
First, the U.K. economy as a whole is not doing well...yet CEOs are enjoying unprecedented pay rises? Surely if top companies are substantially increasing executive pay, it means we're seeing a better economy that allows EVERYONE to share in the success of the market?
What Do You Mean by "Average"?
Second, notice that I started by mentioning the AVERAGE household income, and then I talked about the MEDIAN remuneration and the AVERAGE in the same sentence as if they were the same thing? Isn’t the average supposed to be the mean?
When you hear about an "average" in the news, it is usually the arithmetical mean. With incomes, though, the mean is what you get if you add all incomes together then divide the total by the number of people. If you line everyone up according to income, the median is what's earned by the person who stands in the middle of the line. More on that in a moment.
So we know that the median pay for top executives has gone up by 50% in a year; what I would like to know is how the government determines if we are, as a whole, substantially better off now than a year ago. Trying to answer this question presents the obvious risk that these extreme changes in the course of a single year would blur the real picture and make the whole population look a lot better off than we truly are, but let’s demonstrate it...
For the purpose of this post, let’s assume that the government only looks at the average household income as an indicator of the health of our economy. Let’s also assume we randomly collected a sample of data from a cross section of the population last year and that we did the same again today. The first instinct of a statistician would be to conduct a 2-sample t-test to determine if the two independent average household incomes are significantly different from each other. Ideally though, we would want to collect data from the same people at a year’s interval, so we could conduct a 2-sample paired t-test. For now, let’s stick to a 2 sample- t test. The government did not really fancy the idea of giving me access to their database, so I am using dummy data which, according to my trusted calculations, should not be far off the truth.
Two-Sample t-Test for the Mean
So, I went to Minitab, selected Stat > Basic Statistics > 2-Sample t and filled in the dialog box as illustrated below: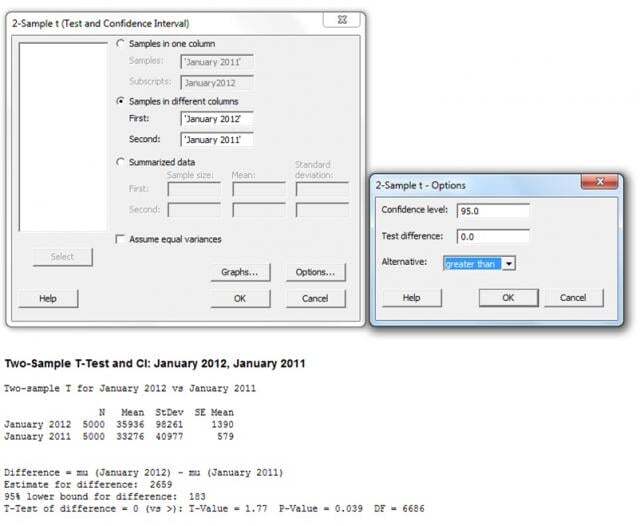
The output of the 2-sample t-test above concludes that based on the dummy sample data, the average household income in 2012 is significantly higher than the average household income of 2011. The mean has gone from £33,276 to £35,936 with a P value of 0.039. Since the P value is lower than the significance level of 0.05, we can conclude that the sample means are different.
Shall we be happy with this? Um...no. Notice that in my original description of a 2-sample t-test, I deliberately omitted to specify what I meant by average. It is now obvious that I am comparing means when, from the very start, everything was hinting towards using medians. I did this deliberately so I could reveal the non-parametric truth of our economy.
The Problem with the Mean
So why should we not compare means in this case? The best way to show it is to graph some data using the histogram feature of Minitab 16 (Graph > Histogram). Note that I've used a slightly different dummy dataset to create this histogram, just so that I can clearly highlight the issue with the mean and make it visually more compelling:
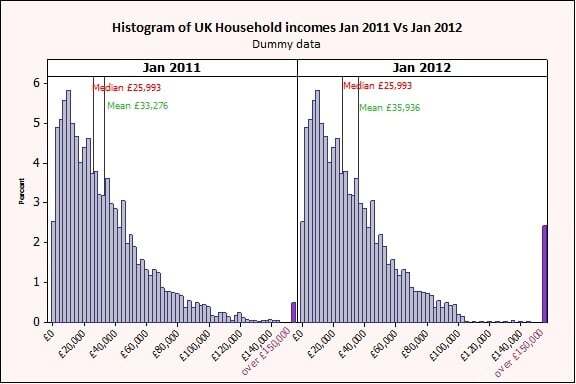
The figure above shows the distribution of U.K. household incomes in Jan 2011 versus Jan 2012. I grouped all the higher incomes (over £150,000) together in purple, and I added reference lines for the mean and the median for illustration purposes.
We can clearly see the effect of executive pay increases by observing the change in size for the purple bins at the far right of the graph. It is also obvious that the data is not normal, as it is bounded at 0 and not symmetrically distributed.
Now notice how the 2 measures of average, mean and median are telling a very different story! The mean has gone from £33,276 to £35,936. However the median remains unchanged at £25,993.
The 2-sample t-test used here is a parametric method that can also be used with nonnormal data as long as the sample size is reasonable (a minimum of 15 observations). I am not going to go into much detail, but this has to do with the properties of the central limit theorem for those who want to investigate further. So nothing, as far as the statistics are concerned, really stops me from using the output from the 2-sample t-test to conclude that there is a significant difference between average household incomes in Jan 2011 versus Jan 2012. However, that is true only if we are happy to accept that the mean is the true reflection of the average.
And this is key…in many studies, including Lean Six Sigma projects, you might be confronted with data where the mean is not necessarily the best reflection of the average. I have come across many projects where the use of the median is preferred, especially for nonsymmetric data bounded at 0 such as times to complete a task for example, or for ordinal data taken from survey results.
Using Nonparametric Hypothesis Tests
Look at the histograms above. When I do, my common sense is telling me that the median is probably a more accurate indicator than the mean of the average for this data. After all, we are looking for a measure of the average that would apply to the majority of the U.K. households, so we want to minimise the effect of unusually high incomes. Minitab has a number of nonparametric tools that allow you to do just that. There are under Stat > Nonparametrics. You will find that for most parametric hypothesis tests, there usually is a nonparametric equivalent:
- 1-Sample Sign: Performs a 1-sample sign test of the median and calculates the corresponding point estimate and confidence interval. Nonparametric alternative to 1-sample Z and 1-sample t-tests.
- 1-Sample Wilcoxon: Performs a 1-sample Wilcoxon signed rank test of the median and calculates the corresponding point estimate and confidence interval. Nonparametric alternative to 1-sample Z and 1-sample t-tests.
- Mann-Whitney: Performs a hypothesis test of the equality of two population medians and calculates the corresponding point estimate and confidence interval. Nonparametric alternative to the 2-sample t-test.
- Kruskal-Wallis: Performs a hypothesis test of the equality of population medians for a one-way design (two or more populations). Nonparametric alternative to the one-way analysis of variance.
- Mood's Median Test: Performs a hypothesis test of the equality of population medians in a one-way design. Mood's median test, like the Kruskal-Wallis test, is a nonparametric alternative to the usual one-way analysis of variance.
- Friedman: Performs a nonparametric analysis of a randomized block experiment . Nonparametric alternative to the two-way analysis of variance.
So let’s try the Mann-Whitney test using the same data (Stat > Nonparametrics > Mann-Whitney) :
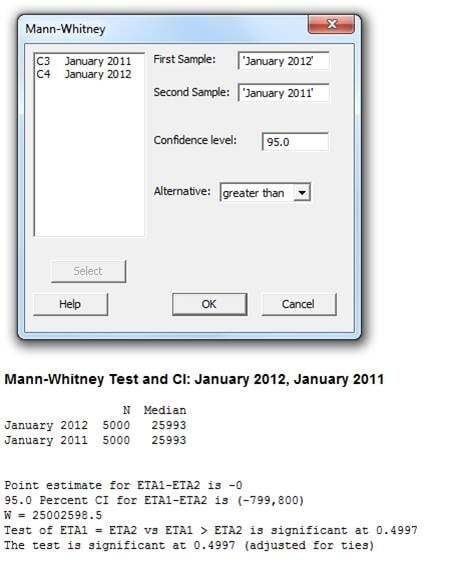
I get a P value of 0.4997, which is greater than the significance level of 0.05. In other words, this test indicates that there is no evidence that the median household income in January 2012 is significantly higher than the median household income in 2011 based on the sample data—a rather different (and more accurate) conclusion than we got with the 2-sample t-test !
So to conclude this exercise, these enormous pay rises at the top are probably not an indication that we are, as a whole benefitting, from a better financial position after all. A number of other factors, such as executive pay alignments to global standards and fierce competition, especially in the banking sector, are probably to blame.
I hope this post highlights why it is so important to establish what the true reflection of the average is before using any hypothesis testing tools, and that it also gives you a good insight into the nonparametric tools available within Minitab.