Within many manufacturing circles, particularly the automotive supply and manufacturing industry, the standard sample size for capability studies are 30 pieces or parts.
Like any statistical calculation, sample size has an inverse effect on the error. As sample size goes up, error goes down. As we evaluate capability of a process, we want the error to be minimized and therefore would arguably want a larger sample size.Why is a process capability study done? There are three reasons:
- To assess the process behavior – is it stable / predictable (‘in-control’) or is it unstable / unpredictable (out-of-control)?
- To assess both the process’ actual performance to the specification as well as its potential to produce parts within specification in the future.
- To determine how many out of specification parts the process is likely to produce.
Where did the rule of 30 come from?
Many people use 30 pieces as a cutoff because of the misconception that for an analysis to be ‘statistically significant’, they need 30 samples. So ‘30’ has become the somewhat arbitrary number that people tend to agree is big enough. While it is true that the number 30 has a role in statistics, particularly with the t-distribution, there is no relationship between that number and the ability to properly assess a process’ behavior and its ability to meet specifications. Unfortunately, in this application, the number 30 is insufficient to properly model the process.
In the Automotive Industry, it’s actually a rule of 100!
For example, in their Statistical Process Control (SPC) and Production Part Approval Process (PPAP) manuals published by the Automotive Industry Action Group (AIAG), they define 100 pieces as the appropriate sample size for an initial capability study (based on 20 subgroups of five or 25 subgroups of four). However, every process is different, so the ‘correct’ number for your process depends on its sources of variation.
Check out the "Streaming Analytics: Introducing the Next Generation of SPC" webinar on-demand!

So What is it? 30 pieces? 100 pieces? More or Less?
Unlike design of experiments or hypothesis testing, capability studies aren’t about statistical power, they’re about variability. Have I properly captured all (or the biggest sources) of my process’ variation in my study? Regardless of how many samples you take, by using Confidence Intervals in your capability analysis, you can get a range of where the true capability might be. Too large a range might be an indicator that your sample was just too small.
Example:
Let’s assume we have a theoretical population (10,000) from a Normal distribution that has a mean of 30mm and a standard deviation of 1mm
With a lower specification (LSL) of 25mm and an upper specification (USL) of 35mm, we know the “true” capability (we will use Pp for simplicity) is 1.67:
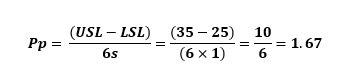
Within Minitab, as you can see, using our entire population, we get a PP of 1.67, which is exactly what we’d expect.
Now let’s take a look at the Pp we get as we sample this population:
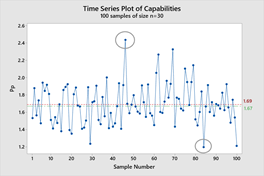
Scenario 1: We sample this population 100 times with n=30
Now if we sample our data 100 times using 30-piece samples, you can see in the graph below we get tremendous variability. Overall, our average Pp was 1.69, which is close to the ‘true’ value, but our samples ranged from a low of 1.19 and a high of 2.44. Effectively, we got a lot of variability in the results of our 30 piece sample, with Pp’s both significantly lower and higher than the actual population Pp. Using just that sample size, we could come to a wrong conclusion.
So How Do We Ensure That We’re Getting Close to the Correct Pp?
A good practice to capture the reliability of our Pp estimate is to use Minitab’s Confidence Intervals, available in Stat>Quality Tools>Capability Analysis>Options. If we sample the process one time, using 30 pieces, and turned on the Confidence Intervals and get the following result:
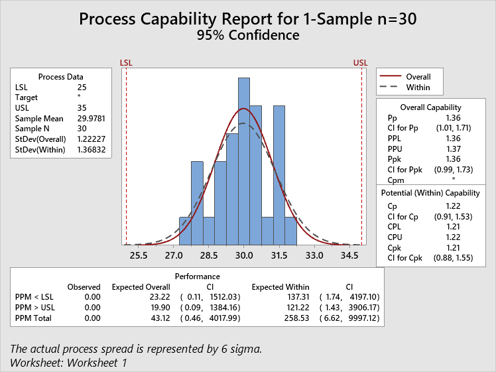
As you can see, based on this single 30-piece sample, we got one of the low values for Pp at 1.36 – not very close to the ‘true’ capability of the population, another unreliable estimate. By only looking at that number, we would believe our process is not capable to 1.67.
However, using a 95% confidence interval, we can see where the ‘true’ capability is likely to be. And a large range like the one we have here as low as 1.01 (not very capable by most standards) or as high as 1.71 (very capable by most standards) is an indicator that we just aren’t sure what this process is truly capable of. More samples will reduce that range.
Conclusion
In general, larger samples will give a much better estimate of the true capability. The AIAG SPC and PPAP manuals recommend at least 100 samples. Sometimes collecting samples can be difficult or costly. Either way, using Minitab’s confidence intervals you will get a better sense of the variability and avoid costly mistakes that could come as a result of a small sample size.
Get a Free Trial of Minitab Statistical Software