New hire recruitment is an inexact science, and past performance does not always guarantee future results. Factors like cultural fit and personal circumstances play an important role in the success of each hire. However, just because it’s inexact doesn’t mean there cannot be science behind it. In fact, human resource executives can significantly boost their chances of hiring successful candidates by doing simple data analysis. With Minitab’s CART® command, recruiters don’t need to understand statistics to build a “recruiting tree.”
Minitab example: Hiring a Sales Representative
Hiring the right salespeople is critical for any organization. Most companies don’t break-even on their investment in a sales representative role for the first 6 to 18 months. Furthermore, the opportunity cost of bringing on a low-performing sales representative makes the hiring process even more costly.
Let’s put ourselves in the shoes of an HR representatives at a medical device company. They are looking to replace a sales rep for one of their top-selling devices, so it is imperative to move quickly and hire the right candidate.
Step 1: Divide Your Sales Team Into High and Low Performers
The beauty of doing this exercise for a sales representative role is that it has quantitative quota. The simplest way to do this is to divide your sales team into two groups: Group 1, those that met their annual quota and Group 2, those that missed their quota. You can also divide them by growth numbers, or profitability, or a different Key Performance Indicator appropriate for your sales team.
Next, consider other measurable characteristics, like years of experience, subject matter background, college Grade Point Average, or even personality traits. You can see in the example below, the HR rep has picked the following characteristics: years of experience when hired, healthcare background - defined as binary (with 1 being yes, has sold in the medical field and 0 being no, has never sold in the medical field), college GPA and personality traits (with 5 being the most extroverted and 1 being the most introverted).

Step 2: Run Your Regression, or Recruiting Tree
When we run the analysis through Minitab Statistical Software using the CART® Classification Tree, we get some very interesting information. Minitab’s CART® command selects the optimal tree (i.e. decision tree scenario) to find the best type of candidate to recruit.
Binary Response Information

Tree Diagram

Step 3: Analyze Your Results
Interestingly, we gain a few insights by looking at the results. First, we can look at the decision tree, which tells us that the ideal candidate is someone who has a personality ranking below 4.5, and a GPA greater than 3.15.
For a sales role, where personality plays a critical role for success, we learn that it’s not the most outgoing person who will be successful. Our model shows that someone who is a 5 has a personality that might be too strong for this role, and may not be the best fit for the position.
What’s also interesting is that the GPA greater than 3.15 separated the groups. Perhaps as part of your job description, rather than having a GPA of 3.0 as a minimum, you can now refine your search.
When you look at the relative variable importance, personality and GPA are the two most important factors to consider for this role.

What is striking is that healthcare background has the lowest impact on success. When recruiting sales candidates, you don’t have to limit yourself to people with a healthcare background.
Step 4: Evaluate the Model
It is always a good idea to assess how well your model can classify the response. While this is a more advanced step, it adds an element of confidence to your model. Don’t let the name ‘Confusion matrix’ confuse you...it’s just a table that tells you how well your model predicted the response!
Confusion Matrix
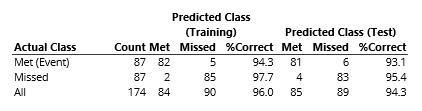

For our model, we correctly predicted that someone would meet their quota, when they met quota 93.1% of the time with our test data. Similarly, we correctly predicted that someone would not meet quota, when in fact they didn’t 95.4% of the time. This is a great model to use to build characteristics for your recruitment profile!
Conclusions
You, too, can easily build a data-driven recruitment profile, and it only took a few minutes to create and understand the model! Now you can focus on screening candidates by factors that matter, not based on perception.
Interested in Learning More About CART?