


A Tutorial for Using Minitab's Python Integration, with Automation and Data Scraping
This blog will show you how easy it is to extend the functionality of Minitab Statistical Software using Python scripts by walking you through a real-life scenario.
What is Python?
First of all, what is Python? There’ll be no reptile jokes here. Python is one of the top open-source programming languages, found at the pinnacle of most data science projects.
While potential uses for Python are vast, it is typically used to:
- Access data from many different sources
- Manipulate and restructure data
- Offer powerful analytical and graphical functions
Python has gained popularity because it offers a general-purpose programming language that is relatively easy to learn, complete with a vast range of libraries and packages that are developed and freely shared by the Python community.
- Python advantages: Python is powerful enough for the most complex applications and is used extensively in industry, science, and education functions. It can be used to automate tasks, perform analysis, and create visualizations. The strengths of Python include these many capabilities and its strong user community that shares handy functions and offers support to other users.
- Python disadvantage: The key drawback to using Python is that because it is a programming language, it has no “point and click” interface. As a result, ad-hoc statistical analysis is time-consuming to perform and requires a good understanding of the Python language.
The Python integration with Minitab
Minitab Statistical Software is an analytics program designed to give everyone access to reliable, easy to understand analytics in a few clicks - with no coding required. Its Python integration allows the user to run Python scripts from the desktop program of Minitab Statistical Software, when additional visualizations, tasks, or analysis are required. Python scripts can be created to perform most of the data analysis tasks or generate graphs and visualizations directly from the user's input.
Tutorial: Web Scraping Covid-19 Data for Automated Analysis
In this tutorial, we’ll take you through some examples illustrating the way that Minitab and Python can be used together to add value to your organization.
The Scenario: During the Covid-19 pandemic, huge amounts of data and visualizations have been shared. It can be confusing to follow which data is from official sources, or how up to date the data is. In this scenario, we want a clear visualization of the latest Covid-19 data released by the UK government.
The Goal: Fancy visualizations do not always depict the true facts, but with Python and Minitab working in tandem, we can quickly import a data source from the government and create our own visualizations that we trust!
First off, we will download the data from the UK government’s website.
We could do this manually, but that process is slow and there are limitations on how many variables can be downloaded at one time. So, we will use the power of our tools to automate this with data scrapping!
Secondly, we will visualize the data clearly within the Minitab Statistical Software desktop program using a Python-powered visualization.
The aim is that by using Minitab and Python together, "the whole is greater than the sum of its parts"! We will generate dependable, up-to-date analysis and visualizations through automation with Python scripts.
In summary, we will use the Minitab Python integration to:
- Set up a script that automatically downloads the latest Covid data - a.k.a. data scraping - from the UK government website
- Prepare the Covid data for analysis
- Then unleash the full power of Minitab's analysis engine!
Disclaimer: The example below is designed to work with a specific URL of the UK government’s website. Please be aware that if the URL changes or is removed, the example will cease to function.
The anticipated Python-powered visualizations
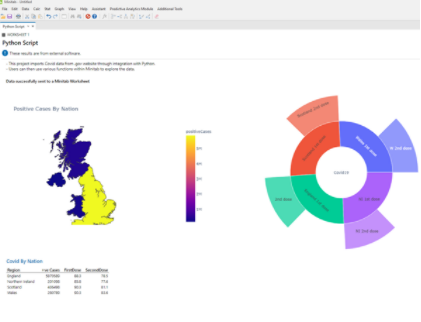
In this exercise, we hope to produce two Python-powered visualizations:
1. A heatmap of Covid-19 cases in the United
Kingdom, updated with the latest data: This heatmap will display the preva
lence of Covid-19 cases for the four nations in the United Kingdom.
The Python script can be extended to show the rate of cases by local authority, and used to track trends and spread across neighborhoods. Geo-mapping is not yet available in Minitab, so the integration allows such visualizations to be included in a Minitab project.
2. An interactive sunburst chart: This type of chart is mostly useful for visualising hierarchical relationships of data. Chart shows the percentage of the eligible population who have received vaccinations, and monitors progress on first and second covid-19 inoculations.
Follow along and try this exercise yourself!
First: Get a free trial of Minitab Statistical Software

Next steps: Download the Python script used in this example including instructions from this link.
Please note that it is the user’s responsibility to make sure the Python script can run outside of Minitab before attempting the integration.
Let’s get started!
Setting up the Minitab Python Integration for the exercise
Now we will do a quick walkthrough of how to install Minitab desktop application, install the Python integration, and run a script. Setting up this up is little technical, so we have created a series of short GIFs to simplify the setup.
- Install Minitab Statistical Software
Today you can use Minitab Statistical Software as either a desktop program or an online SaaS application ('Software-as-as-Service') in your browser. At this time, the Python integration is only available with the desktop version.
In this GIF, we show how you install the desktop version of Minitab:

- Install Python with Anaconda
You can use the Anaconda distribution, which is easy to install on a Windows machine. Anaconda aims to provide everything you need from Python for data science in an 'out of the box' package. This includes a number of its most-often used 3rd party libraries.
Here is how the Anaconda installation will look:

3. Install Python Module - mtbpy
This module can be easily installed using pip and provides the ability for Python scripts to communicate with Minitab Statistical Software.

- Run Minitab from Anaconda
To make sure communication between Minitab and Python is less temperamental, we recommend running Minitab in an Anaconda environment. However, this is optional as the default Python installation also works.

- Set Up Minitab Options
Specify the default file location for opening Python scripts and Minitab files, otherwise Minitab Statistical Software looks in “My Documents”, a default location for Windows.
-Jul-06-2025-12-08-27-1410-AM.gif?width=650&name=1_5-mtb-options-edited%20(1)-Jul-06-2025-12-08-27-1410-AM.gif)
- Test Python Minitab Integration
Minitab Statistical Software provides a simple Python script that can be used to test if the integration is successful.

How to Run a Python Script in Minitab
Step-by-Step Guide
Run the Python script linked above.
*Every user is responsible for making sure the Python script can run outside of Minitab before attempting the integration.

Use this link to access information about the integration, including a step-by-step guide on how to run Python scripts in Minitab:
If you have trouble, contact Minitab support and they will be happy to help.
How to run the script:
1. Open Anaconda Prompt
2. Change directory to your Minitab installation folder i.e. Run >> cd C:\Program Files\Minitab\Minitab 20
3. Run >> mtb.exe to open Minitab
4. In Minitab set the Default file location – File > Options
5. Show the Minitab’s Command Line - View > Command Line/History
6. Enter Metrics of interest in column 1 as shown below
7. Select the following commands and copy to Command Line as shown below.
PYSC "CovidDataByRegion.py"
WOPEN "CovidDataByRegion.csv"
8. In the Command Line pane, click Run

The final result: Python visualizations automatically updated by Minitab Statistical Software

This example we have created above demonstrates that you can use:
- Static Python visuals
- Interactive Python visuals
in the Output pane of Minitab Statistical Software, by using the Minitab Python integration.
To automate the entire procedure, you could make use of a Minitab macro. An example of this is shown in the GIF below:

Enjoy The Unlimited Possibilities of Python with Minitab Statistical Software
Try this use case out on your own. Get Minitab Statistical Software for free!