Predictive analytics models in Minitab Statistical Software can be an incredibly valuable asset in all industries. Business value can be generated from predicting measures such as customer churn, patient length of stay, costs, risk, profits, and many other factors.
In this blog, we’ll look at an application in the banking industry. For a bank, providing a mortgage to the wrong person can be a mistake costing hundreds of thousands of dollars. Given these stakes, it is extremely important that banks understand their customers and make predictions about them before deciding to approve or reject their mortgage application. Let’s see how Minitab Predictive Analytics can minimize the number of mortgage defaults by accurately predicting what customers are likely to default in the future.
Understand the Mortgage Data
Below is a section of the observational data utilized in the analysis. There are 1,645 observations on previous customer mortgages. Column C1 displays the response variable, or target, which contains yes if that person defaulted on their mortgage or no if they did not. The other 9 columns contain the features we will evaluate as potential predictors.

Current State of Mortgage Default
The pie chart below helps us to better understand the rate at which borrowers defaulted on their mortgage. We see that 10% of mortgages were defaulted on. Reducing that percentage can greatly increase profits.

Compare Predictive Models
To tackle this challenge, we look to the Minitab Predictive Analytics Module.
Learn more about this module in this on-demand Webinar:

Since the response is yes or no, we will utilize a classification model. If interested in a continuous response, a tree-based regression model would be used. The Predictive Analytics Module contains three classification modeling types:
For classification, one of the main metrics to evaluate the goodness of fit of the model is the area under the ROC curve. The closer to 1 this metric is the better. Each of the three modeling engines in the module were utilized and the respective values for area under the ROC curve were compared.
TreeNet classification produced an area under the ROC curve of 0.9695. This value outperformed the areas under the ROC curves for models from the other two modeling engines meaning that the TreeNet classification model generated is the best predictive model for mortgage default. TreeNet Gradient Boosting is Minitab’s most flexible, award-winning and powerful machine learning tool, and it is capable of consistently generating extremely accurate models. Of the three modeling engines, TreeNet often tends to produce the best results.
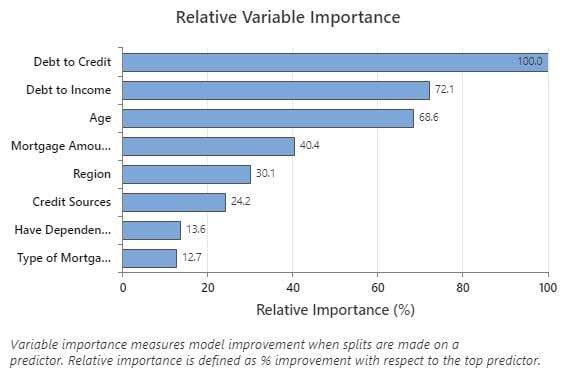
Visualize Important Variables
Let’s first look at the relative variable importance graph as a part of our model output. Relative variable importance values range from 0% to 100% with the most important variable always being 100%. Debt to Credit is the most important variable in predicting mortgage default and it is followed by Debt to Income as the second most important. Eight of the nine features are important to the model in some capacity.
Make Predictions on Probability of Default
Now that we have our model in Minitab, we can make our predictions. We can enter individual values into Minitab to predict or columns of values if it would be valuable to make higher volumes of predictions at once.
We have the following data on an individual that has applied for a $485,000 mortgage:
- Age 43
- Earnings of $81,000
- 9 Credit Sources
- Debt to Credit Ratio of 0.68
- Debt to Income Ratio of 0.73
- Residential Mortgage
- From the Northwest Region
- No Dependents
We enter these values into the predictive model to obtain a probability that the individual defaults as shown in the prediction output below. The probability that this individual defaults on their mortgage is over 97%. Once the predictions are made, then you, the one with the industry knowledge, can interpret the prediction and act on it. I would think it would be likely an individual with a 97% probability of default would be rejected for a mortgage.
-Jul-06-2025-12-36-22-8579-AM.png?width=771&name=MicrosoftTeams-image%20(7)-Jul-06-2025-12-36-22-8579-AM.png)
Making predictions when values for all the predictors are available is always the best-case scenario but realistically there are many times when some values of the predictors are missing. Predictive analytics in Minitab make it easy for us to still make predictions when this happens. In the example below, there are several missing values. Even with the missing values, we can still obtain a prediction for the probability this customer defaults on their mortgage.
We have another potential customer that has applied for a $375,000 mortgage. We don’t have data on the earnings, the debt to income ratio, the region, and the number of dependents for this applicant. We do have the following information:
- Age 49
- 4 Credit Sources
- Debt to Credit Ratio of 0.31
- Residential Mortgage
Despite the missing values, we are still able to make a prediction and see that there is less than a 1% chance that this customer defaults on their mortgage as shown below.
-Jul-06-2025-12-36-21-8059-AM.png?width=727&name=MicrosoftTeams-image%20(8)-Jul-06-2025-12-36-21-8059-AM.png)
Based on the analysis, this individual looks to be a good candidate for a mortgage as the probability of them defaulting is less than 1% based on the predictive model. This is just one example of how Minitab’s tree-based machine learning algorithms can help you tackle complex problems and gain valuable insights.
Learn how you can apply the power of the Minitab Predictive Analytics Module in your industry