


While there are many new predictive analytics and machine learning tools in the market, Regression is a classical tool for building predictive models. Regression allows the user to model the relationship between a response and various predictors. Companies need to properly implement predictive tools, and, Minitab’s Regression can help achieve meaningful predictive modeling capability!
Minitab Statistical Software makes it easier than ever to perform regression analysis:
- Build, verify and visualize a predictive model.
- Validate the predictive power of the model.
- Automate analysis and model selection.
- Predict new outcomes and optimize parameters.
Today we'll focus on the building, verifying and visualizing a predictive model (check out Part 2 for the more advanced features of validating predictive power, automating analysis and model selection, and predicting new outcomes and optimizing parameters!).
Regression helps answer a range of questions that commonly confront professionals in almost every industry (i.e. marketing, finance, manufacturing, medical device, pharmaceuticals, food science, etc.) It can determine which inputs can predict a response and which ones are most impactful. Strong regression models can even be used to calculate expected values and forecast the impact of future changes. Remember, these models are not implying causation, but association.
Build, Verify and Visualize a Predictive Model in Minitab Statistical Software
Minitab’s Regression can help quantify how continuous and categorical predictors affect a response of interest—and can easily add complex terms to the predictive model, interactions and polynomial terms, using the built-in features.
Consider an example for a food manufacturing company. The engineers at the company need to determine how three potential packaging designs and time in hours affect the shelf life of their product (measured in moisture). Their focus is on the first 72 hours after sealing the package.
Regression analysis is often used to fit a linear model with only the main effects for the predictors. In this example, the model would contain a separate intercept for each packaging design, but each model would have the same slope. Adding polynomial terms and interactions will be a more robust analysis.
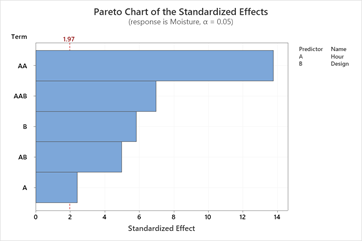
In the Stat > Regression > Regression > Fit Regression Model after entering the response, continuous predictors, and categorical predictors, the Model button can easily add complexity to the model for more accurate predictions with interactions and polynomial terms. A Pareto plot shows the impact of these terms in the model and the residual plots are used to check model assumptions.

The below Pareto Effects Plot is a simple graph that shows significant terms versus non-significant terms. If a term’s standardized effect crosses the red line, then the p-value is less than the designated alpha value, in this case 0.05, which makes the term significant. The size of the bar shows the relative impact of the terms in the model: both hours and package design are essential to understanding moisture content in this product.
The predictive model for moisture includes hours, hours2, package design, and the interactions between these terms. Minitab simplifies the model by displaying a separate model for each of the three package designs. The differences in the constants and the slopes between the designs are due to the significant interactions.

Residual plots help the analyst verify the assumptions of Regression. Check for departures from normality, unequal variance or lack of independence to ensure the analysis is valid and appropriate.

Once all the due diligence is done, the analyst needs to present the findings. Factorial plots help to represent the numeric output into easy to read graphs for visualizing the model. If the goal is to minimize moisture levels in the product over the crucial 72-hour period, Design 2 is best.

Regression isn’t new — but Regression is an extremely powerful modeling tool that all data analysts should master. Minitab makes it easy and accessible to build and visualizing predictive models.
If you’re not already using the power of Minitab to get the maximum value from your data, download a free, fully-functional 14-day trial of Minitab Statistical Software today.

See how our experts can help turn your company's data into actionable insights. Learn more about our Training Services today!